Support and Resistance in Forex: How to Identify Key Levels and Trade Them
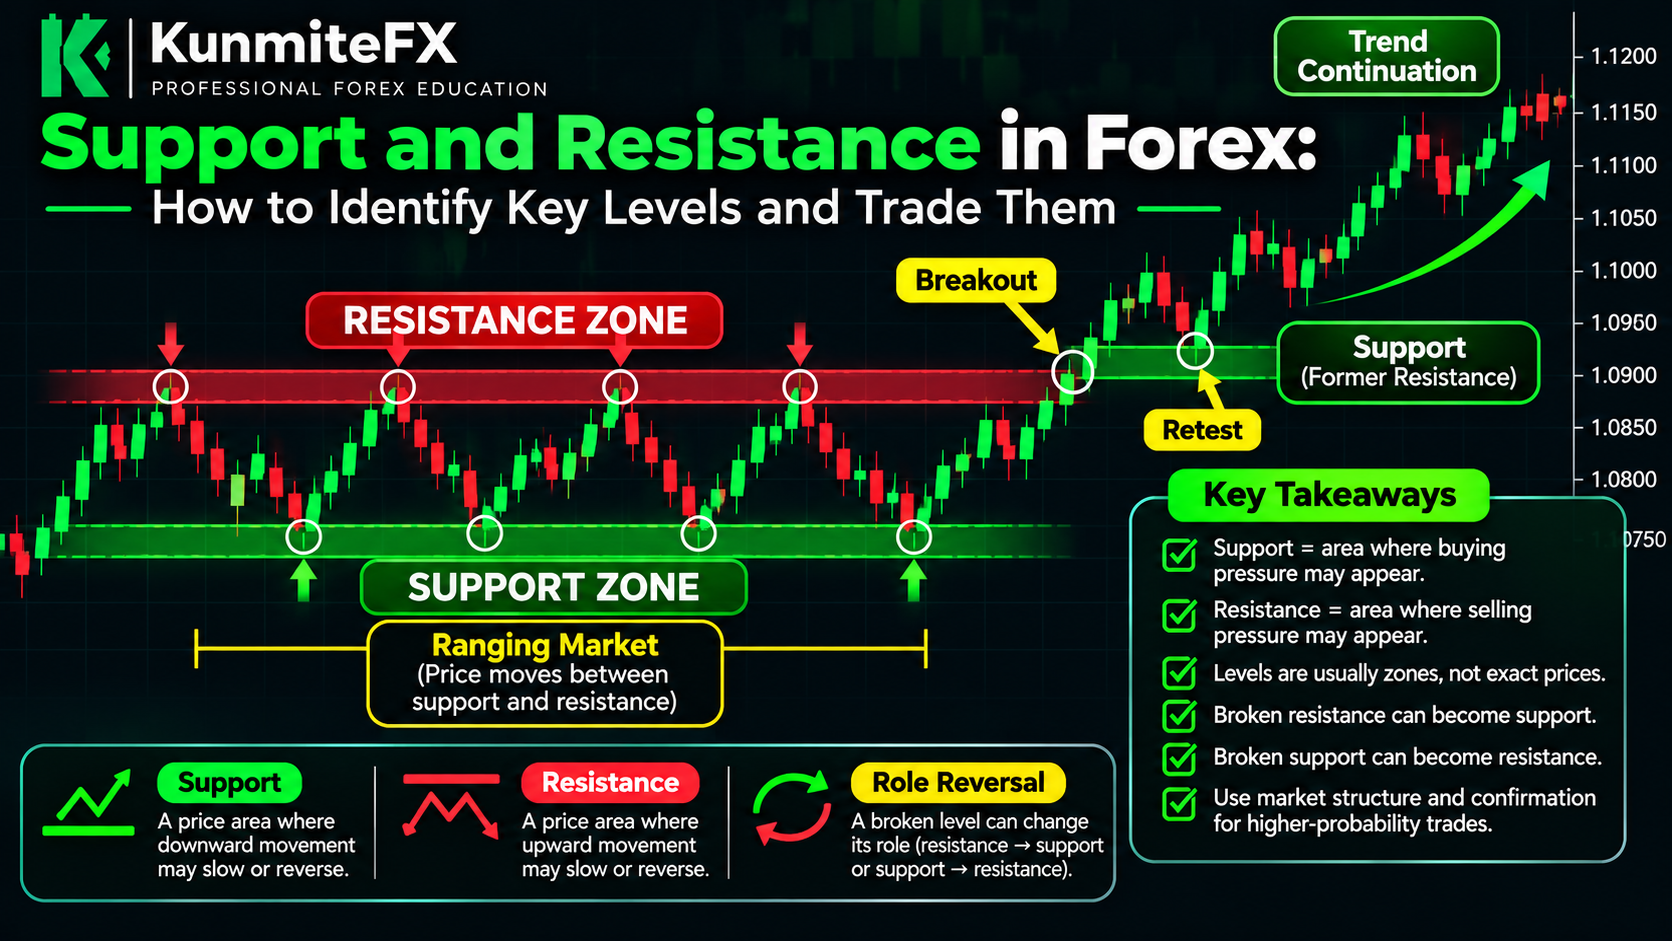
Support and Resistance in Forex: How to Identify Key Levels and Trade Them
One of the first concepts most forex traders encounter is:
support and resistance.
The idea sounds simple.
Support is an area where price may stop falling.
Resistance is an area where price may stop rising.
But in practice, many traders struggle with questions such as:
Where exactly should I draw the level?
Should it be a line or a zone?
What makes one level stronger than another?
What happens when support breaks?
Can resistance become support?
Should I enter every time price reaches a level?
Support and resistance become much more useful when you understand them as areas of market reaction rather than magical prices that must always hold.
What Is Support in Forex?
Support is an area where buying pressure may become strong enough to slow or temporarily stop a decline.
Imagine EUR/USD falls toward:
1.0800
Price reaches that area and begins rising.
Later, price returns toward 1.0800 and buyers respond again.
That area may begin to act as support.
Support can form because traders may:
consider the price attractive
close short positions
enter buy positions
place pending orders near the level
The result is increased demand around that area.
What Is Resistance?
Resistance is the opposite.
It is an area where selling pressure may become strong enough to slow or temporarily stop an upward move.
Suppose GBP/USD rises toward:
1.3000
Price reaches the area and falls.
Later, it returns to 1.3000 and reacts lower again.
That area may be considered resistance.
Possible reasons include:
traders taking profits
sellers entering
buy positions being closed
pending sell orders
Support and Resistance Are Usually Zones
A common beginner mistake is drawing one exact horizontal line and expecting price to reverse precisely at that number.
Markets are rarely that perfect.
Instead of thinking:
Support = exactly 1.0800
it may be more useful to think:
Support zone = approximately 1.0790 to 1.0810
Price may move slightly through the level before reversing.
This is why many traders mark:
zones
rather than one-pixel lines.
Why Price Reacts at Key Levels
Support and resistance can develop for several reasons.
Previous Market Reactions
Traders remember areas where price reacted strongly before.
If price approaches that area again, market participants may respond.
Order Concentration
Buy and sell orders may cluster around visible levels.
Psychological Prices
Round numbers such as:
1.1000
1.2000
or:
$2,000 gold
can attract attention.
Previous Highs and Lows
Swing highs and lows naturally become important reference points.
This connects directly to market structure.
How Support Connects With Market Structure
In a bullish market, price may create:
Higher High → Higher Low → Higher High
That higher low can become a support area.
If price later pulls back into that region, traders may watch for another bullish reaction.
Market structure therefore helps identify which support levels may matter.
How Resistance Connects With Market Structure
In a bearish market, price may create:
Lower Low → Lower High → Lower Low
The lower high can become resistance.
When price rallies back into that area, sellers may become interested again.
This is why support/resistance works best when combined with context.
Previous Resistance Can Become Support
One of the most common price-action concepts is:
resistance becoming support.
Suppose price repeatedly fails to move above:
1.1000
Eventually, buyers push through that resistance.
Price rallies higher.
Later, price pulls back toward:
1.1000
Instead of falling through immediately, buyers respond.
The old resistance may now act as:
support
This is sometimes called:
role reversal
or:
support/resistance flip.
Previous Support Can Become Resistance
The reverse can also happen.
Suppose:
1.2500
has acted as support several times.
Eventually, price breaks below it.
Later, price rallies back toward 1.2500.
Sellers enter and price falls again.
The old support may now act as:
resistance
Why Broken Levels Can Change Roles
When an important level breaks, trader positioning can change.
Imagine traders previously bought at support.
If support breaks, some of those buyers may be trapped in losing positions.
When price returns to the level, they may exit.
Other traders may see the former support as a new area to sell.
This can help explain why role reversals occur.
How to Identify Strong Support and Resistance
Not every level is equally important.
Several factors can increase the significance of a level.
1. Multiple Reactions
If price reacts from an area several times, traders may pay more attention to it.
2. Strong Price Movement Away
A level that caused a sharp move may be more significant than one that produced only a tiny reaction.
3. Higher Timeframe
A support zone visible on the daily chart may generally carry more significance than a tiny level on the 1-minute chart.
4. Market Structure Alignment
Support inside a bullish trend may be more useful for a bullish strategy.
Resistance inside a bearish trend may be more useful for a bearish strategy.
5. Confluence
A level may become more interesting when multiple factors align.
For example:
previous swing low
higher-timeframe support
round number
trend continuation area
Higher-Timeframe Support and Resistance
Higher timeframes can provide broader market context.
Common timeframes include:
daily
4-hour
1-hour
A trader may first mark important levels on the daily or 4-hour chart.
Then they can move to a lower timeframe for more precise analysis.
This can prevent the chart from becoming overloaded with insignificant levels.
How to Draw Support and Resistance
A simple process is:
Step 1: Zoom Out
Look at a larger section of the chart.
Step 2: Identify Major Swing Highs and Lows
Mark obvious turning points.
Step 3: Look for Repeated Reactions
Ask where price has repeatedly changed direction.
Step 4: Draw Zones
Cover the general reaction area rather than forcing one exact price.
Step 5: Keep Only Important Levels
Too many levels can make the chart difficult to read.
Example of Support
Suppose EUR/USD falls toward:
1.0750
and reacts higher.
Later it returns to approximately:
1.0740–1.0760
and rallies again.
That zone may be marked as support.
A trader should not automatically buy simply because price reaches the zone.
Instead, they may wait for additional evidence.
Example of Resistance
Suppose GBP/USD rises toward:
1.2900
and falls sharply.
Later it returns toward:
1.2890–1.2910
and sellers respond again.
That area may be resistance.
Again, touching resistance alone is not necessarily enough for an entry.
Support and Resistance Need Confirmation
This is important.
Price reaching support does not guarantee a bounce.
Price reaching resistance does not guarantee a rejection.
Support can break.
Resistance can break.
Some traders therefore wait for confirmation such as:
rejection candle
change in lower-timeframe structure
engulfing pattern
momentum shift
failed breakout
The specific confirmation depends on the trading strategy.
What Is a False Breakout?
A false breakout happens when price moves beyond a support or resistance level but fails to continue.
For example:
Resistance:
1.1000
Price briefly moves to:
1.1020
Traders assume the breakout is confirmed.
Then price quickly falls back below 1.1000.
That can be considered a false breakout.
False breaks are common.
This is another reason traders may wait for confirmation.
Breakout vs Rejection
When price reaches a key level, two broad outcomes are possible.
Rejection
Price touches or enters the area and moves away.
Breakout
Price pushes through the area and continues.
The trader's job is not to assume one must happen.
The goal is to observe how price behaves at the level.
How to Trade a Support Rejection
Suppose:
higher timeframe is bullish
price pulls back into support
market structure remains bullish
lower timeframe shows bullish confirmation
A trader using a continuation strategy may consider a buy.
The stop might be placed:
below the level that invalidates the setup
The target could be:
the previous high
or another resistance area.
Position size should then be calculated based on the stop distance and planned risk.
How to Trade a Resistance Rejection
Suppose:
higher timeframe is bearish
price rallies into resistance
structure remains bearish
lower timeframe confirms weakness
A trader may consider a sell.
The stop might be placed:
above the structural invalidation point
The target may be:
the previous low
or the next support zone.
How to Trade a Breakout and Retest
Some traders prefer not to enter during the initial breakout.
Instead they wait for:
breakout → pullback → retest
Example:
Resistance at:
1.1000
Price breaks above it.
Instead of buying immediately, the trader waits.
Price returns toward 1.1000.
The old resistance now acts as support.
If bullish confirmation appears, the trader may consider entering.
This approach may help avoid some false breakouts, though it cannot eliminate them.
Support and Resistance With Market Structure
This is where the previous KunmiteFX article becomes important.
Suppose the market is creating:
HH → HL → HH
Bullish structure.
Price then pulls back toward a previous higher low that also aligns with old resistance.
You now have:
bullish structure
support
previous resistance turned support
This provides more context than simply buying because price touched a horizontal line.
Support and Resistance With Stop Losses
Key levels can help identify where a trade idea becomes invalid.
Suppose you buy from support.
If price breaks clearly below the structure supporting the trade, your original bullish idea may no longer be valid.
The stop-loss location should make sense based on the setup.
After choosing the stop, calculate position size.
Do not choose lot size first and then force a stop around it.
Support and Resistance With Risk-to-Reward
Key levels can also help determine targets.
Suppose:
Entry:
near support
Stop:
below support
Target:
previous resistance
You can calculate:
Potential Reward ÷ Potential Risk
If the available reward is too small relative to the stop, the trade may not meet your trading plan.
Round Numbers as Psychological Levels
Forex traders often watch prices ending in round numbers.
Examples:
1.1000
1.2500
150.00
These levels can attract orders and attention.
But round numbers should not automatically be treated as strong support/resistance.
They are more useful when they align with other evidence.
Dynamic Support and Resistance
Support and resistance do not always have to be horizontal.
Some traders also use:
trendlines
moving averages
channels
These are sometimes called:
dynamic support and resistance
However, horizontal levels are usually one of the simplest places for beginners to start.
Support and Resistance in Ranging Markets
Support and resistance become especially visible in ranges.
Suppose price moves repeatedly between:
Support:
1.0900
Resistance:
1.1000
Traders may observe:
buying pressure near support
selling pressure near resistance
But ranges eventually break.
Therefore, assuming support or resistance will hold forever can be dangerous.
Support and Resistance in Trending Markets
In a strong uptrend:
previous resistance levels may repeatedly become support.
In a strong downtrend:
previous support levels may repeatedly become resistance.
This is one reason trend direction matters.
Common Support and Resistance Mistakes
1. Drawing Too Many Levels
If your chart has 30 horizontal lines, almost every price will appear to be near support or resistance.
Focus on important levels.
2. Treating Levels as Exact Prices
Think in zones rather than perfect numbers.
3. Entering Without Confirmation
A level alone may not be enough.
4. Ignoring Market Structure
Support inside strong bearish structure may break.
Resistance inside strong bullish structure may break.
5. Ignoring Higher Timeframes
A small lower-timeframe level may be insignificant compared with a major daily level.
6. Assuming More Touches Always Mean Stronger Level
Repeated testing can sometimes weaken a level rather than strengthen it.
Market context matters.
Fresh Levels vs Heavily Tested Levels
Some traders pay attention to how often a zone has been tested.
A relatively fresh level may still contain unfilled orders.
A heavily tested level may become weaker as orders are consumed.
This idea should not be treated as an absolute rule.
But it can provide additional context.
Do Not Predict—React
Support and resistance should not become:
“Price must reverse here.”
A better mindset is:
“This is an area where I expect increased interest. I will watch how price behaves.”
That small change can reduce emotional attachment to a trade idea.
A Simple Support and Resistance Checklist
Before entering, ask:
What is the higher-timeframe trend?
Where are the major swing highs?
Where are the major swing lows?
Which levels have caused strong reactions?
Is this a zone or just one random price?
Has the level been tested repeatedly?
Is the level aligned with market structure?
Has old resistance become support?
Has old support become resistance?
Is there confirmation?
Where is invalidation?
Does the trade meet my risk-to-reward requirement?
Example of Bullish Confluence
Imagine:
Daily chart:
Bullish
4-hour structure:
Higher Highs + Higher Lows
Price pulls back into:
former resistance
That former resistance is now acting as:
support
Lower timeframe shows:
bullish confirmation
This creates several pieces of evidence pointing in the same direction.
That does not guarantee a winning trade.
But it creates more structure than entering randomly.
Example of Bearish Confluence
Imagine:
Daily chart:
Bearish
4-hour structure:
Lower Highs + Lower Lows
Price rallies toward:
former support
That level now acts as:
resistance
Lower timeframe begins turning bearish.
A trader may then evaluate:
stop location
target
position size
risk percentage
risk-to-reward
Support and Resistance Should Fit Your Trading Plan
Your trading plan might include rules such as:
Only trade major support/resistance visible on the 4-hour chart.
Enter only when market structure aligns with the level.
Require confirmation before entry.
Minimum risk-to-reward: 1:2.
Maximum risk per trade: 1%.
This turns support/resistance from a vague concept into a repeatable process.
How to Practice Support and Resistance
You can practice without risking money.
Open historical charts.
Mark:
major highs
major lows
repeated reaction zones
breakout levels
support/resistance flips
Then move forward candle by candle.
Ask:
Did the level hold?
Did it break?
Did price retest it?
What did market structure look like?
This can help develop chart-reading experience.
Support and Resistance and the KunmiteFX Framework
The KunmiteFX trading framework now connects several important concepts:
Market Structure
shows direction.
Support and Resistance
identifies important price areas.
Trading Plan
defines whether the setup qualifies.
Stop Loss
defines invalidation.
Position Size
controls financial risk.
Risk-to-Reward
compares potential loss and reward.
Trading Journal
records execution.
A complete process may look like:
Structure → Key Level → Confirmation → Entry → Stop → Position Size → Target → Journal → Review
Final Thoughts
Support and resistance are simple concepts, but they become powerful when combined with context.
Remember:
Support is an area where buyers may respond.
Resistance is an area where sellers may respond.
Levels are usually zones, not exact prices.
Broken resistance can become support.
Broken support can become resistance.
Not every level will hold.
Market structure matters.
The goal is not to predict exactly where price will reverse.
The goal is to identify areas where market behaviour may change and then wait for enough evidence to support your trading plan.
Before your next trade, ask:
Am I trading a meaningful level or am I simply drawing lines until the chart agrees with me?
Continue building your trading knowledge with KunmiteFX educational tools and resources.