Forex Trading Journal: How to Track Your Trades and Improve Your Trading
Forex Trading Journal: How to Track Your Trades and Improve Your Trading
Most traders remember their biggest wins.
They also remember the painful losses.
But memory is not a reliable trading record.
After several weeks of trading, it can become difficult to remember exactly why you entered a position, whether you followed your strategy, how much you risked, what the market looked like or what emotions influenced your decision.
That is why keeping a forex trading journal can be so valuable.
A trading journal gives you a structured record of your decisions.
Instead of simply asking:
“Did I make or lose money?”
you can begin asking better questions:
Did I follow my strategy?
Which setups perform best?
Am I risking consistently?
Which mistakes keep repeating?
Do my emotions affect certain trades?
When do I trade best?
A good trading journal turns individual trades into data you can actually learn from.
What Is a Forex Trading Journal?
A forex trading journal is a record of your trading activity.
It can include information such as:
currency pair
trade direction
entry price
stop loss
take profit
position size
risk percentage
risk-to-reward ratio
entry reason
market conditions
trade result
emotional state
screenshots
mistakes
lessons learned
Some traders use spreadsheets.
Others use dedicated trading-journal software.
Some prefer a printable workbook.
The format matters less than the habit of recording useful information consistently.
Why Is a Trading Journal Important?
Looking only at profit and loss tells you what happened financially.
It does not necessarily explain why it happened.
Suppose you finish the month with:
+$500
That sounds positive.
But what if your journal shows that:
most of your planned trades lost only small amounts
one oversized trade created almost all the profit
you broke your risk rules several times
you moved stop losses
you entered trades because of FOMO
The account made money, but the process may still be dangerous.
Now imagine another trader finishes the month slightly negative.
But the journal shows:
position sizing remained consistent
every stop loss followed the strategy
no revenge trading occurred
all entries matched the trading plan
the strategy simply experienced a normal losing period
That trader may actually have a healthier process.
A journal helps separate short-term financial results from decision quality.
Profit Does Not Always Mean a Good Trade
This is one of the most important reasons to journal.
Imagine you enter a trade without analysis.
You use an oversized position.
You have no stop loss.
The market moves strongly in your favour and you make:
$1,000
Was that a good trade?
Financially, yes.
From a process perspective, probably not.
The profit may encourage you to repeat risky behaviour.
Now imagine you follow your trading plan perfectly.
You risk:
1%
The setup is valid.
The stop is correctly placed.
The position size is calculated properly.
The market reaches your stop loss.
Was that automatically a bad trade?
No.
Losses are part of trading.
Your journal should therefore evaluate both:
Outcome
and:
Execution
What Should You Record Before a Trade?
Your journal should begin before you enter the position.
This is important because writing down your reasoning can expose weak trades before money is involved.
1. Date and Time
Record when the setup appeared.
This allows you to later examine whether your strategy performs differently during:
London session
New York session
Asian session
market overlaps
major news periods
2. Currency Pair or Market
Record exactly what you are trading.
For example:
EUR/USD
GBP/USD
XAU/USD
This allows you to determine whether certain markets work better with your strategy.
3. Trade Direction
Record whether you are:
Long / Buy
or:
Short / Sell
4. Entry Price
Record the price where you plan to enter.
5. Stop-Loss Price
Write down the stop before entering.
If you cannot identify where the trade idea becomes invalid, you may not yet have a complete setup.
6. Take-Profit Target
Record your planned target.
This allows you to calculate the potential reward relative to the risk.
7. Risk Percentage
For example:
0.5%
1%
or whatever amount your trading plan allows.
8. Position Size
Record the lot size used.
This helps verify whether position sizing remains consistent with your risk rules.
9. Risk-to-Reward Ratio
For example:
1:2
This tells you how much potential reward exists relative to the planned loss.
10. Reason for Entry
This may be the most important field.
Write exactly why the trade exists.
For example:
Price returned to a previous support zone, rejected the level and confirmed bullish structure on the lower timeframe.
That is much more useful than:
I think it will go up.
Take a Screenshot Before Entering
A chart screenshot can provide information that numbers alone cannot.
Capture the chart before entering.
Mark:
entry
stop loss
take profit
important support/resistance
market structure
trend
setup confirmation
Later, when reviewing the trade, you can compare what you originally saw with what actually happened.
Screenshots are especially useful because hindsight can change how we remember a chart.
After price moves strongly, the correct decision can sometimes appear obvious.
The original screenshot shows what information was genuinely available at the time.
Record Your Emotional State
Trading decisions are not made by spreadsheets.
They are made by people.
Record how you felt before entering.
For example:
Calm
Confident
Patient
Bored
Frustrated
Afraid of missing out
Trying to recover a loss
Overconfident
You may eventually discover patterns.
Perhaps your trades after two consecutive losses perform badly because you become impatient.
Perhaps you take unnecessary positions when bored.
Perhaps winning streaks cause you to increase lot sizes.
Without a journal, those patterns can remain invisible.
What Should You Record After the Trade?
After the position closes, complete the journal entry.
Record:
exit price
profit or loss
percentage result
R-multiple
whether the trade followed the plan
mistakes
lessons
emotional reaction
This transforms the journal from a trade log into a learning tool.
What Is an R-Multiple?
An R-multiple expresses the trade result relative to the amount originally risked.
Suppose you risk:
$50
That $50 represents:
1R
If you make:
$100
your result is:
+2R
If you lose:
$50
your result is:
-1R
If you make:
$25
your result is:
+0.5R
Using R can make it easier to compare trades across different account sizes and position sizes.
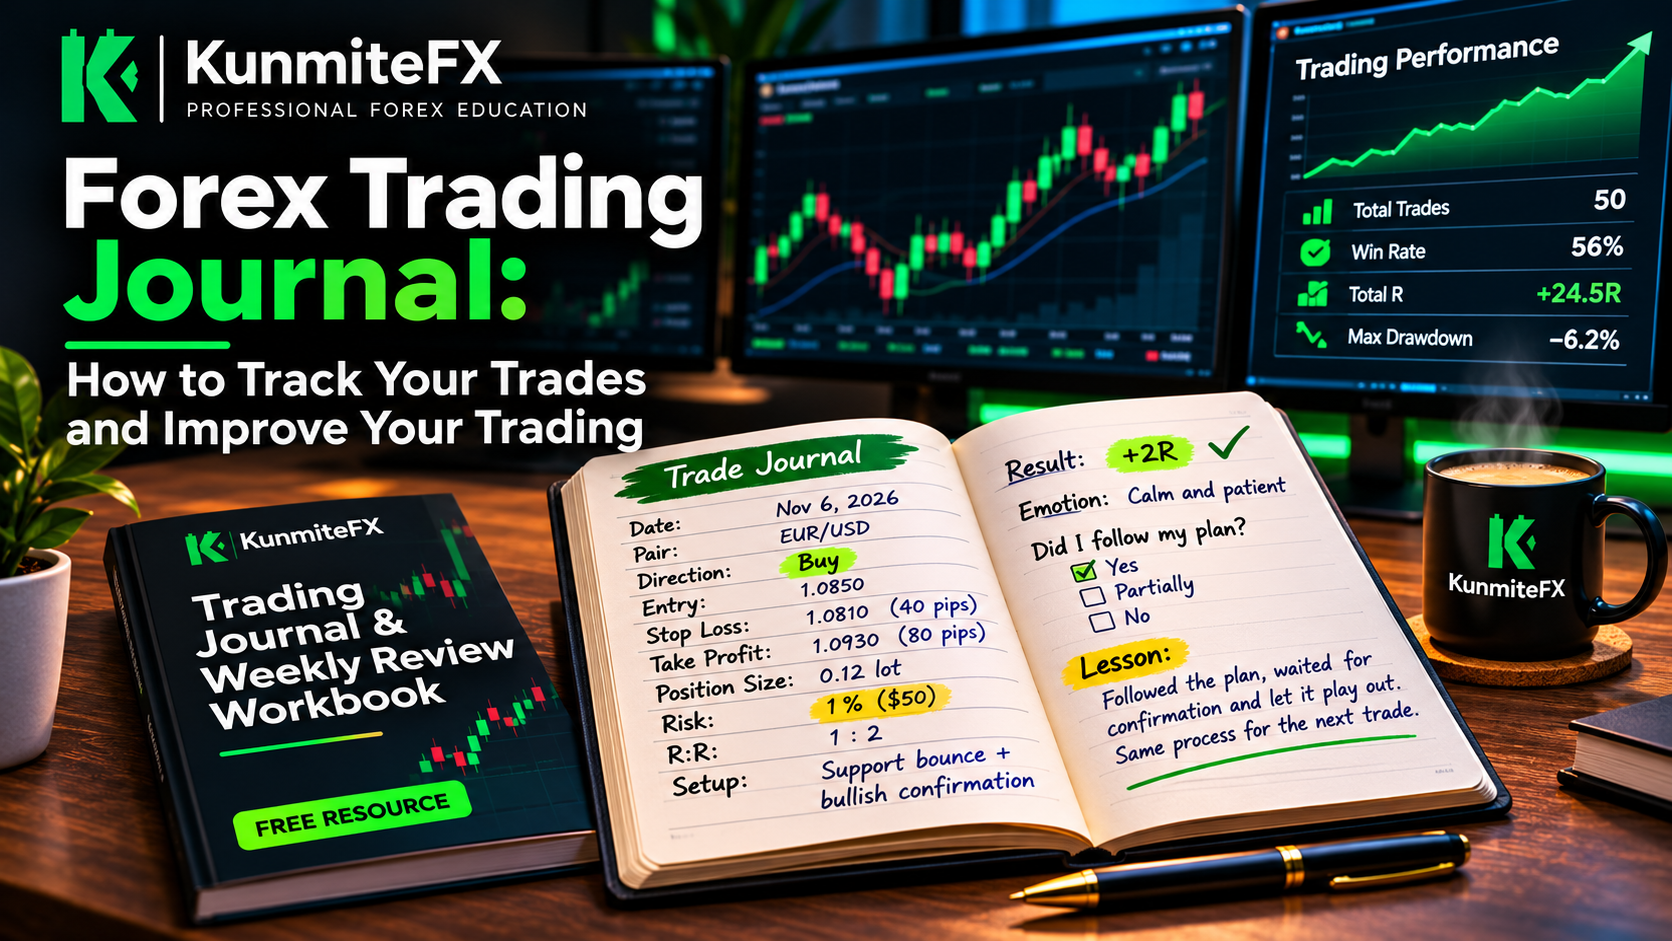
Example of a Journal Entry
Imagine the following trade:
Pair: EUR/USD
Direction: Buy
Account balance: $5,000
Risk: 1%
Maximum planned loss: $50
Entry: 1.0850
Stop loss: 1.0810
Stop distance: 40 pips
Target: 1.0930
Potential reward: 80 pips
Risk-to-reward: 1:2
Entry reason: Price returned to a support zone and formed bullish confirmation aligned with the higher-timeframe structure.
Emotion before trade: Calm
The trade reaches the target.
Result:
+2R
The journal entry could then include:
Followed the plan. Entry was patient. Stop was not moved. No major execution mistake identified.
Now compare that with another trade:
Result: +1.5R
But the notes say:
Entered early because I was afraid of missing the move. Position size was larger than planned.
Even though the trade made money, the journal identifies behaviour that should not be repeated.
Track Whether You Followed Your Rules
Consider adding a simple field:
Did I follow my trading plan?
Options:
Yes
Partially
No
After 50 trades, you can compare performance between:
rule-following trades
and:
rule-breaking trades
That can produce valuable information.
You may discover that your strategy performs reasonably well when followed correctly but poorly when you improvise.
The solution might therefore not be finding a completely new strategy.
It might be improving execution.
Track Setup Type
If your strategy uses several setups, classify each trade.
For example:
breakout
pullback
trend continuation
reversal
support/resistance rejection
liquidity sweep
range trade
After enough trades, you can compare results.
Perhaps one setup produces:
+18R
while another produces:
-7R
That information can help you decide where to focus your attention.
Track Trading Session
You may also categorize trades by session:
London
New York
Asian
Suppose your journal eventually shows:
London:
+14R
New York:
+9R
Asian:
-8R
That does not automatically mean you should never trade the Asian session.
But it gives you a reason to investigate further.
Track Day of the Week
Some traders also record:
Monday
Tuesday
Wednesday
Thursday
Friday
You may discover performance differences.
Again, the goal is not to invent rules based on a few trades.
The goal is to collect enough information to identify meaningful patterns.
Record Major News Events
Forex can move dramatically around economic announcements.
Consider noting whether the trade occurred near events such as:
interest-rate decisions
inflation reports
employment data
central-bank speeches
GDP releases
You may discover that your strategy behaves differently during major news periods.
Journal Losing Trades Carefully
Losses are often where the most useful lessons appear.
But avoid treating every losing trade as a mistake.
Ask:
Did the setup match my rules?
Was risk correct?
Was the stop logically placed?
Did I execute the trade correctly?
If yes, the loss may simply be part of the strategy.
A trader who changes their system after every loss may never collect enough data to properly evaluate anything.
Journal Winning Trades Too
Winning trades also need review.
Ask:
Did I follow the plan?
Did I exit early?
Did I take unnecessary risk?
Did luck hide poor execution?
A winning trade can contain serious mistakes.
Do not allow profit to prevent honest review.
How a Trading Journal Can Help With FOMO
Suppose your journal contains a field called:
Reason for Entry
After one month, you notice that several losing trades contain statements such as:
Entered because price was moving quickly.
Didn't want to miss the breakout.
Entered before confirmation.
That is evidence of FOMO.
Now the problem is measurable.
You can create a rule:
No trade unless confirmation is complete.
Your journal then allows you to monitor whether behaviour improves.
How a Journal Can Reveal Revenge Trading
Imagine your journal shows that trades taken immediately after losses have significantly worse results.
You may discover a pattern:
Loss → larger position → rushed entry → another loss
That can justify introducing a rule such as:
After a losing trade, wait at least 15 minutes before considering another setup.
Or:
Stop trading after reaching the daily loss limit.
The journal turns an emotional problem into something you can observe and manage.
Weekly Trading Review
Recording trades is only half the process.
You also need to review them.
At the end of each week, calculate:
Total trades
Winning trades
Losing trades
Win rate
Total R gained/lost
Average winning trade
Average losing trade
Largest win
Largest loss
Maximum weekly drawdown
Then review behaviour.
Ask:
Did I follow my risk limits?
Did I move any stop losses?
Did I revenge trade?
Did I overtrade?
Did I miss valid setups because of fear?
Which setup performed best?
Which mistake occurred most often?
What should I improve next week?
The goal is not just collecting information.
The goal is turning information into better decisions.
Monthly Trading Review
A monthly review provides a larger sample.
Look for patterns across multiple weeks.
Compare:
setup performance
currency pairs
trading sessions
risk levels
psychological mistakes
rule-following percentage
average R per trade
overall drawdown
This can help you distinguish between:
one bad week
and:
a persistent problem
Win Rate Is Not Enough
Suppose Trader A has:
80% win rate
But average winner:
+$20
Average loser:
-$200
Trader B has:
45% win rate
Average winner:
+$200
Average loser:
-$100
The trader with the higher win rate does not automatically have the stronger strategy.
Your journal should therefore examine:
win rate + average win + average loss + risk-to-reward
not win rate alone.
Calculate Expectancy
With enough data, traders can estimate expectancy.
A simplified formula is:
Expectancy = (Win Rate × Average Win) − (Loss Rate × Average Loss)
Suppose:
Win rate:
50%
Average winning trade:
2R
Loss rate:
50%
Average losing trade:
1R
Then:
(0.50 × 2R) − (0.50 × 1R)
=
1R − 0.5R
=
+0.5R
This simplified example suggests positive expectancy over a sufficiently large sample.
It does not guarantee future profitability.
But it demonstrates why journal data becomes useful.
How Many Trades Should You Review?
Avoid making major conclusions from:
3 trades
or:
5 trades
Small samples can be misleading.
Depending on the strategy and frequency, traders may review:
20 trades
50 trades
100 trades
or more before drawing stronger conclusions.
The more consistent the trading rules, the more useful the data becomes.
Keep the Journal Simple Enough to Use
A journal containing 75 questions may look impressive.
But if you stop using it after three days, it has little value.
Start with the most important information:
market
entry
stop
target
risk
position size
setup
screenshot
result
emotion
rule-following
lesson
You can add more data later.
Consistency is more useful than complexity.
Do Not Change Your Strategy Every Week
A trading journal can create another temptation.
You might look at five losing trades and immediately redesign the strategy.
That makes long-term analysis difficult.
If every week uses different rules, your journal contains data from multiple strategies rather than one consistent process.
Make changes deliberately and document them.
If Strategy Version 1 changes significantly, label the next version.
That allows you to compare results fairly.
A Simple Pre-Trade Journal Checklist
Before entering, record:
What market am I trading?
What is my setup?
Where is my entry?
Where is my stop?
How many pips am I risking?
What percentage of my account am I risking?
What position size does that require?
Where is my target?
What is my risk-to-reward ratio?
Is major news approaching?
How do I feel right now?
Does the trade fully match my plan?
A Simple Post-Trade Checklist
After the trade closes, record:
What was the result?
What was the result in R?
Did I follow the plan?
Did I move my stop?
Did I exit early?
Did emotion affect the decision?
What went well?
What went wrong?
What will I repeat?
What will I avoid next time?
The KunmiteFX Trading Process
Our previous KunmiteFX articles covered:
Position sizing
Risk-to-reward
Stop-loss placement
Leverage and margin
Risk per trade
Drawdown
Trading psychology
A trading journal connects all of these topics.
It allows you to record whether you actually used the principles you learned.
A complete process may look like:
Trading Plan → Setup → Risk Calculation → Position Size → Execution → Journal → Review → Improvement
Without review, traders can repeat the same mistakes without realizing it.
Download the Free KunmiteFX Trading Journal
To make this easier, we created the:
KunmiteFX Trading Journal & Weekly Review Workbook
It includes structured sections for:
trade details
risk
entries and exits
emotional state
trade review
lessons learned
weekly performance
monthly review
You can download it free from the KunmiteFX Free Resources section and use it alongside your trading practice.
Final Thoughts
A trading journal cannot guarantee profitable trading.
But it can help you understand your own behaviour.
Instead of relying on memory, you build evidence.
Instead of saying:
“I always lose on Fridays.”
you can check the data.
Instead of saying:
“My strategy doesn't work.”
you can check whether you actually followed it.
Instead of saying:
“I think I'm overtrading.”
you can measure how many unnecessary trades you took.
The purpose of a journal is not to create more paperwork.
It is to make your trading process visible.
What gets recorded can be reviewed.
What gets reviewed can be improved.
So after your next trade, do not simply close the chart and move on.
Record what happened.
Then ask:
What can this trade teach me?
Continue building your trading knowledge with KunmiteFX educational tools and resources.