Forex Market Structure Explained: Higher Highs, Lower Lows and Trend Direction
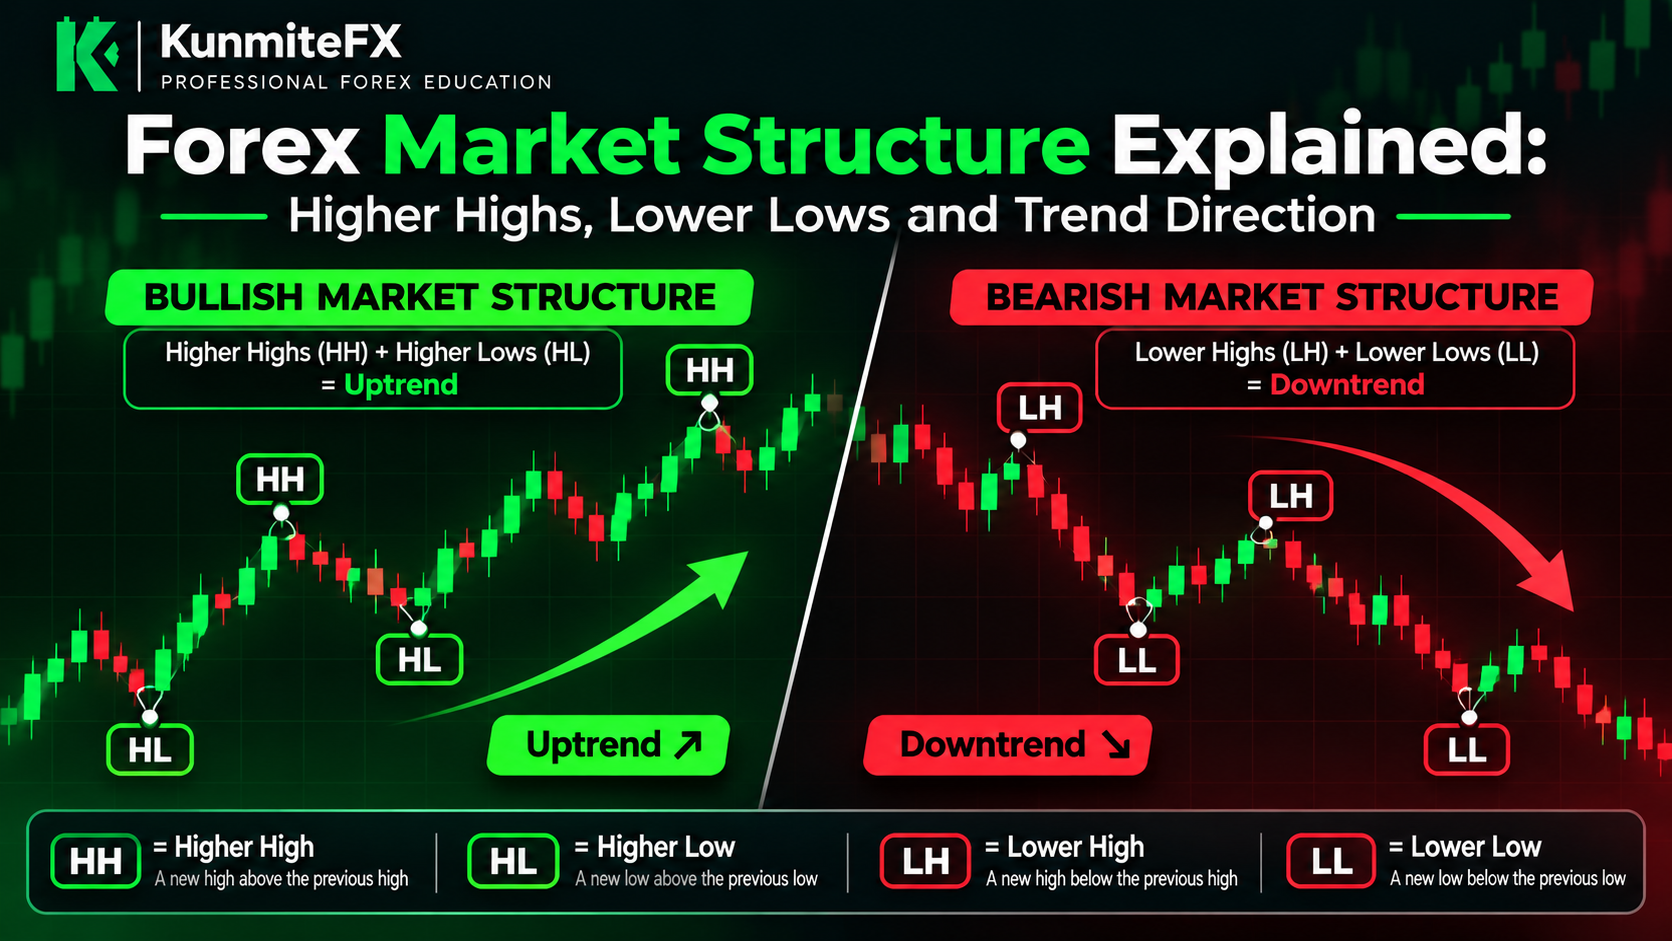
Forex Market Structure Explained: Higher Highs, Lower Lows and Trend Direction
Before learning complicated indicators, trading systems or entry techniques, every forex trader should understand one basic concept:
market structure.
Market structure describes how price is moving.
It helps traders answer questions such as:
Is the market trending upward?
Is it trending downward?
Is price moving sideways?
Is the current trend becoming weaker?
Has market direction potentially changed?
Instead of looking at every candle individually, market structure helps you look at the larger sequence of price movements.
The foundation is surprisingly simple.
Price moves through a series of:
highs
and:
lows
By studying how those highs and lows develop, traders can begin to identify trend direction.
What Is Forex Market Structure?
Market structure refers to the pattern created by price as it moves between swing highs and swing lows.
A swing high is an area where price moves upward, reaches a temporary peak and then begins moving lower.
A swing low is an area where price moves downward, reaches a temporary bottom and then begins moving higher.
These swings create the structure of the market.
The most common patterns are:
Higher High — HH
Higher Low — HL
Lower High — LH
Lower Low — LL
Understanding these four terms can make reading charts much clearer.
What Is a Higher High?
A higher high occurs when price creates a new high above the previous significant high.
Imagine EUR/USD rises to:
1.1000
Price pulls back.
Later, price rallies again and reaches:
1.1100
The new high at 1.1100 is higher than the previous 1.1000 high.
Therefore it can be described as a:
Higher High — HH
Higher highs are commonly associated with bullish market structure.
What Is a Higher Low?
A higher low occurs when price pulls back but does not fall below the previous significant low.
For example:
Price rises.
Then pulls back to:
1.0950
Later, after making a higher high, it pulls back again but only reaches:
1.1020
The second low is above the previous low.
That becomes:
Higher Low — HL
A sequence of:
Higher Highs + Higher Lows
commonly represents an upward trend.
Bullish Market Structure
A bullish market typically develops through a sequence like:
Higher Low → Higher High → Higher Low → Higher High
Visually:
HL → HH → HL → HH
Price is gradually moving upward.
Buyers are able to push price to new highs.
When sellers create pullbacks, those pullbacks remain above previous significant lows.
This does not mean price moves upward in a straight line.
Even strong bullish markets contain pullbacks.
The important point is the overall structure.
What Is a Lower Low?
A lower low occurs when price falls below the previous significant low.
Suppose GBP/USD falls to:
1.2500
Price then rallies temporarily.
Later, it falls again and reaches:
1.2400
The second low is below the first.
Therefore:
1.2400 = Lower Low
Lower lows are commonly associated with bearish market structure.
What Is a Lower High?
A lower high occurs when price rallies but fails to reach the previous significant high.
For example:
Price falls.
It then rallies to:
1.2600
Later, after making a lower low, price rallies again but reaches only:
1.2550
That second high is lower than the previous high.
Therefore it becomes:
Lower High — LH
A sequence of:
Lower Highs + Lower Lows
commonly represents a downward trend.
Bearish Market Structure
A bearish market commonly develops like:
Lower High → Lower Low → Lower High → Lower Low
Or:
LH → LL → LH → LL
Sellers continue pushing price to lower levels.
Buyer rallies fail to recover the previous highs.
This creates a downward structural sequence.
The Three Basic Market Conditions
Most price action can broadly be described as:
Bullish
Price produces:
Higher Highs + Higher Lows
Bearish
Price produces:
Lower Highs + Lower Lows
Range / Consolidation
Price repeatedly moves between support and resistance without consistently producing new structural highs or lows.
Recognizing which environment you are trading in is important because the same strategy may behave differently in each condition.
Example of Bullish Structure
Suppose EUR/USD behaves like this:
Swing low:
1.0800
Swing high:
1.0900
New swing low:
1.0850
New swing high:
1.1000
New swing low:
1.0920
New swing high:
1.1100
The lows are moving higher:
1.0800 → 1.0850 → 1.0920
The highs are also moving higher:
1.0900 → 1.1000 → 1.1100
That is a clear example of bullish structure.
Example of Bearish Structure
Now imagine GBP/USD:
Swing high:
1.2800
Swing low:
1.2700
New swing high:
1.2760
New swing low:
1.2600
New swing high:
1.2690
New swing low:
1.2500
Highs:
1.2800 → 1.2760 → 1.2690
Lows:
1.2700 → 1.2600 → 1.2500
Both are moving lower.
That represents bearish structure.
Why Market Structure Matters
Market structure provides context.
Without context, a bullish candle may look like a buying opportunity.
But if the larger market is creating lower highs and lower lows, that bullish candle may simply be a temporary pullback inside a bearish trend.
Likewise, a bearish candle inside a strong bullish structure may only represent a normal correction.
Market structure helps you avoid judging every candle in isolation.
Market Structure and Trend Direction
Many traders use market structure to determine whether they should primarily look for:
buy opportunities
or:
sell opportunities
For example:
If the market is consistently forming higher highs and higher lows, a trader may prefer looking for bullish setups during pullbacks.
If the market is creating lower highs and lower lows, they may prefer bearish setups during rallies.
This does not mean you should blindly buy every higher low or sell every lower high.
Structure provides direction.
Your strategy still needs an entry trigger.
What Is a Swing High?
A swing high is a local price peak.
Price moves upward into the area, fails to continue higher temporarily and reverses downward.
Not every tiny high on a one-minute chart should necessarily be treated as a meaningful structural level.
The significance of a swing often depends on:
timeframe
surrounding price action
size of the move
strategy
This is why two traders can sometimes mark slightly different swings while still interpreting the larger structure similarly.
What Is a Swing Low?
A swing low is the opposite.
Price moves downward, reaches a temporary bottom and begins moving higher.
Important swing lows often become reference points for:
stop losses
support areas
trend continuation
potential structure breaks
Understanding which swings matter is part of developing chart-reading experience.
Major Structure vs Minor Structure
Charts contain structure inside structure.
For example:
The daily chart may be bullish.
The 4-hour chart may also be bullish.
But the 15-minute chart may temporarily be bearish because price is pulling back.
That means:
minor bearish structure can exist inside major bullish structure.
This is one reason traders use multiple timeframes.
Multi-Timeframe Market Structure
Suppose the daily chart is forming:
HH → HL → HH
Bullish.
The 4-hour chart is currently pulling back.
The 15-minute chart shows:
LH → LL → LH
Bearish.
This does not necessarily mean the entire market has become bearish.
It may simply mean the lower timeframe is showing the internal structure of the higher-timeframe pullback.
Once that lower-timeframe bearish structure changes, some traders may look for continuation in the higher-timeframe bullish direction.
Higher Timeframes Usually Provide More Context
A common mistake is making decisions from a very small timeframe without checking the larger picture.
For example:
The 5-minute chart may appear strongly bullish.
But the 4-hour chart could be approaching a major resistance area inside a larger bearish trend.
The lower timeframe is not necessarily wrong.
It simply shows a smaller part of the market.
A useful approach is:
Higher timeframe = context
Lower timeframe = execution
What Is a Break of Structure?
A break of structure occurs when price breaks beyond an important previous swing point.
For example:
In an uptrend:
HH → HL → HH → HL
Suppose price then rallies through the previous high.
That continuation above the prior high may be described as a:
bullish break of structure
Similarly, in a bearish market, breaking below a previous significant low may represent bearish continuation.
Different trading methodologies define BOS slightly differently, so consistency with your own framework is important.
Structure Breaks Can Signal Continuation
Imagine an uptrend.
Price creates:
Higher High
then:
Higher Low
Price later breaks above the previous higher high.
This can provide evidence that bullish momentum is continuing.
But a break alone is not a guarantee that price will keep rising.
False breaks happen.
Context still matters.
When Market Structure Begins to Change
Suppose a bullish market has been making:
HH → HL → HH → HL
Then price suddenly breaks below the previous higher low.
That may be an early sign that the bullish structure is weakening.
The market may eventually begin producing:
Lower Highs + Lower Lows
However, one break does not automatically guarantee a complete trend reversal.
Price may:
reverse
consolidate
reclaim the level
create a false break
Structure should be interpreted as evidence, not certainty.
Example of a Potential Bullish-to-Bearish Change
Imagine:
Higher high:
1.1100
Higher low:
1.1000
New higher high:
1.1200
Price then falls below:
1.1000
Instead of creating another higher low, price has broken a significant previous low.
Later, price rallies but only reaches:
1.1080
That creates a:
Lower High
Price then drops to:
1.0950
creating:
Lower Low
Now the structure has shifted from:
HH + HL
to:
LH + LL
That gives stronger evidence of bearish structure.
What Is a Range?
Markets do not always trend.
Sometimes price becomes trapped between:
resistance above
and:
support below
Price repeatedly moves between the two without creating a clear directional sequence.
For example:
Resistance:
1.1000
Support:
1.0900
Price may bounce between these levels multiple times.
In this environment, applying trend-following logic without recognizing the range can create poor entries.
How to Identify a Range
Signs may include:
repeated rejection from similar highs
repeated support near similar lows
no consistent higher-high sequence
no consistent lower-low sequence
overlapping candles
frequent failed breakouts
A ranging market often requires different expectations than a trending market.
Do Not Force a Trend
One common beginner mistake is feeling that every chart must be:
bullish
or:
bearish
Sometimes the correct answer is:
unclear.
If structure is messy, waiting can be better than inventing a trend that is not clearly present.
A trader does not need a position at all times.
Market Structure and Support/Resistance
Market structure often works together with support and resistance.
A higher low may form near:
previous resistance turned support
A lower high may form near:
previous support turned resistance
Combining structural direction with meaningful price levels can provide more context than using either concept alone.
Market Structure and Stop-Loss Placement
Structure can also help identify logical stop locations.
Suppose you are buying during bullish structure.
Your trade idea may become invalid if price breaks below an important higher low.
That structural level may provide a more meaningful reference than choosing a random:
10-pip stop
or:
20-pip stop
Once the logical stop distance is known, position size can be adjusted to maintain your planned financial risk.
Market Structure and Risk-to-Reward
Structure can help identify realistic targets.
For example:
You enter during a bullish pullback.
Potential stop:
below the higher low.
Potential target:
previous higher high.
You can then calculate whether the trade offers acceptable risk-to-reward.
If the target is too close compared with the stop, the setup may not satisfy your trading plan.
Market Structure and Your Trading Plan
Your trading plan can define what type of structure you require.
For example:
Only buy when the 4-hour chart is producing higher highs and higher lows.
Then your lower timeframe entry rules might say:
Wait for a pullback and bullish confirmation.
This creates a repeatable process.
Example of a Structured Bullish Trade
Suppose:
Daily structure:
Bullish
4-hour structure:
Bullish
Price pulls back toward:
support
The previous higher low remains intact.
Lower timeframe begins showing bullish confirmation.
A trading plan may then allow the trader to consider an entry.
Before entering, they still calculate:
stop-loss location
position size
risk percentage
target
risk-to-reward
Structure identifies context.
Risk management controls exposure.
Example of a Structured Bearish Trade
Suppose:
Daily trend:
Bearish
4-hour chart:
LH → LL → LH
Price rallies into previous support that may now act as resistance.
Lower timeframe begins weakening.
A trader using a bearish continuation strategy may consider an entry after confirmation.
Again:
Market structure does not replace the rest of the trading process.
Common Market Structure Mistakes
1. Marking Every Tiny Swing
If every small candle movement becomes an HH, HL, LH or LL, the chart can become confusing.
Focus on swings relevant to your timeframe and strategy.
2. Ignoring Higher Timeframes
A bullish 5-minute chart can exist inside a bearish daily market.
Always understand the larger context.
3. Assuming Every Structure Break Is a Reversal
Price can temporarily break a level and then return.
Wait for enough evidence before declaring a complete trend change.
4. Entering Without Confirmation
Structure tells you direction.
It does not automatically tell you the exact entry.
5. Forgetting Risk Management
Even the clearest structure can fail.
Every trade still needs controlled risk.
A Simple Market Structure Checklist
Before entering a trade, ask:
What is the higher-timeframe structure?
Is it bullish, bearish or ranging?
Where are the major swing highs?
Where are the major swing lows?
Is price producing HH + HL or LH + LL?
Has an important swing been broken?
Is the current movement a trend or a pullback?
Am I trading with or against the larger structure?
Where would the trade idea become invalid?
Does the setup fit my trading plan?
How Market Structure Fits Into the KunmiteFX Framework
At this point, the KunmiteFX education framework connects:
Market Structure
understanding direction.
Trading Plan
defining which setups you are allowed to trade.
Stop Loss
identifying where the idea becomes invalid.
Position Size
controlling financial exposure.
Risk-to-Reward
measuring potential reward relative to risk.
Trading Psychology
helping you execute consistently.
Trading Journal
recording what actually happened.
A structured process may look like:
Market Context → Setup → Entry → Stop → Position Size → Target → Execute → Journal → Review
Practice Market Structure Without Trading
One of the best ways to learn structure is to practice on historical charts without placing trades.
Open a chart.
Choose a timeframe.
Mark:
HH
HL
LH
LL
Then move forward candle by candle.
Ask:
When did the trend become clear?
When did structure weaken?
Where did price range?
Which break actually led to reversal?
This allows you to build pattern recognition without financial pressure.
Final Thoughts
Market structure is one of the foundations of technical analysis.
It does not require complicated indicators.
At its core, you are studying how price moves between highs and lows.
Remember:
Higher Highs + Higher Lows = Bullish Structure
Lower Highs + Lower Lows = Bearish Structure
Repeated similar highs and lows = Possible Range
The goal is not to predict every candle.
The goal is to understand the environment you are trading in.
Once the structure is clear, you can combine it with:
support and resistance
entry confirmation
stop-loss placement
position sizing
risk-to-reward
your trading plan
That creates a much more complete decision-making process.
Before your next trade, ask yourself one simple question:
What is the market structure actually telling me?
Continue building your trading knowledge with KunmiteFX educational tools and resources.