Forex Drawdown Explained: How to Measure It, Control It and Recover
Forex Drawdown Explained: How to Measure It, Control It and Recover
Every trader eventually experiences a period when their account falls below a previous high.
That decline is called a drawdown.
Drawdown is one of the most important measurements in trading because it tells you something that profit alone cannot:
How much pain did the account experience while producing its results?
Two traders might both make 20% over a year.
But if one trader experienced a 10% drawdown while the other experienced a 60% drawdown, their risk profiles were completely different.
Understanding drawdown can help you evaluate your trading strategy, control position sizes and avoid taking so much risk that recovering becomes extremely difficult.
What Is Drawdown in Forex?
Drawdown measures the decline in your trading account from a previous peak to a subsequent low.
Suppose your account grows from:
$10,000
to:
$12,000
Your account then falls to:
$10,800
The drawdown is measured from the $12,000 peak.
Dollar drawdown:
$12,000 − $10,800 = $1,200
Percentage drawdown:
$1,200 ÷ $12,000 × 100 = 10%
Your account therefore experienced a:
10% drawdown
even though it is still above the original $10,000 starting balance.
This is an important distinction.
Drawdown is measured from the previous account high, not necessarily from your original deposit.
What Is Maximum Drawdown?
Maximum drawdown is the largest decline from a peak to a later low during a particular period.
Imagine your account performs like this:
Starting balance:
$10,000
Account rises to:
$12,000
Then falls to:
$10,800
Drawdown:
10%
Later, the account rises to:
$15,000
Then falls to:
$12,000
Drawdown:
20%
The maximum drawdown during this period would be:
20%
Maximum drawdown can therefore provide useful information about how much capital a strategy has historically lost during its worst period.
Balance Drawdown vs Equity Drawdown
There is another distinction traders should understand.
Balance Drawdown
This looks primarily at completed trades.
If a losing trade has not yet been closed, the loss may not appear fully in the account balance.
Equity Drawdown
Equity includes the effect of open positions.
Suppose your account balance is:
$10,000
but your open positions currently have:
-$1,000
in unrealized losses.
Your equity may be approximately:
$9,000
Even though your balance still shows $10,000, your account is already experiencing significant exposure.
For this reason, equity can sometimes provide a more realistic view of what is happening to the account in real time.
Why Drawdown Matters
Many traders focus almost entirely on profits.
They ask:
“How much did the strategy make?”
But another important question is:
“How much did the strategy lose along the way?”
A trading strategy that produces strong returns while repeatedly experiencing enormous drawdowns may be difficult to maintain.
Drawdown affects:
available trading capital
emotional decision-making
position sizing
margin availability
confidence in the strategy
ability to recover losses
The deeper the drawdown becomes, the harder the recovery can become.
Why Recovery Gets Harder After Large Losses
Losses and recoveries are not symmetrical.
If your account loses 10%, you do not need exactly 10% growth to recover.
You need slightly more.
10% Drawdown
Starting account:
$10,000
After 10% loss:
$9,000
To return to $10,000:
$1,000 ÷ $9,000 = 11.1%
You need approximately:
11.1%
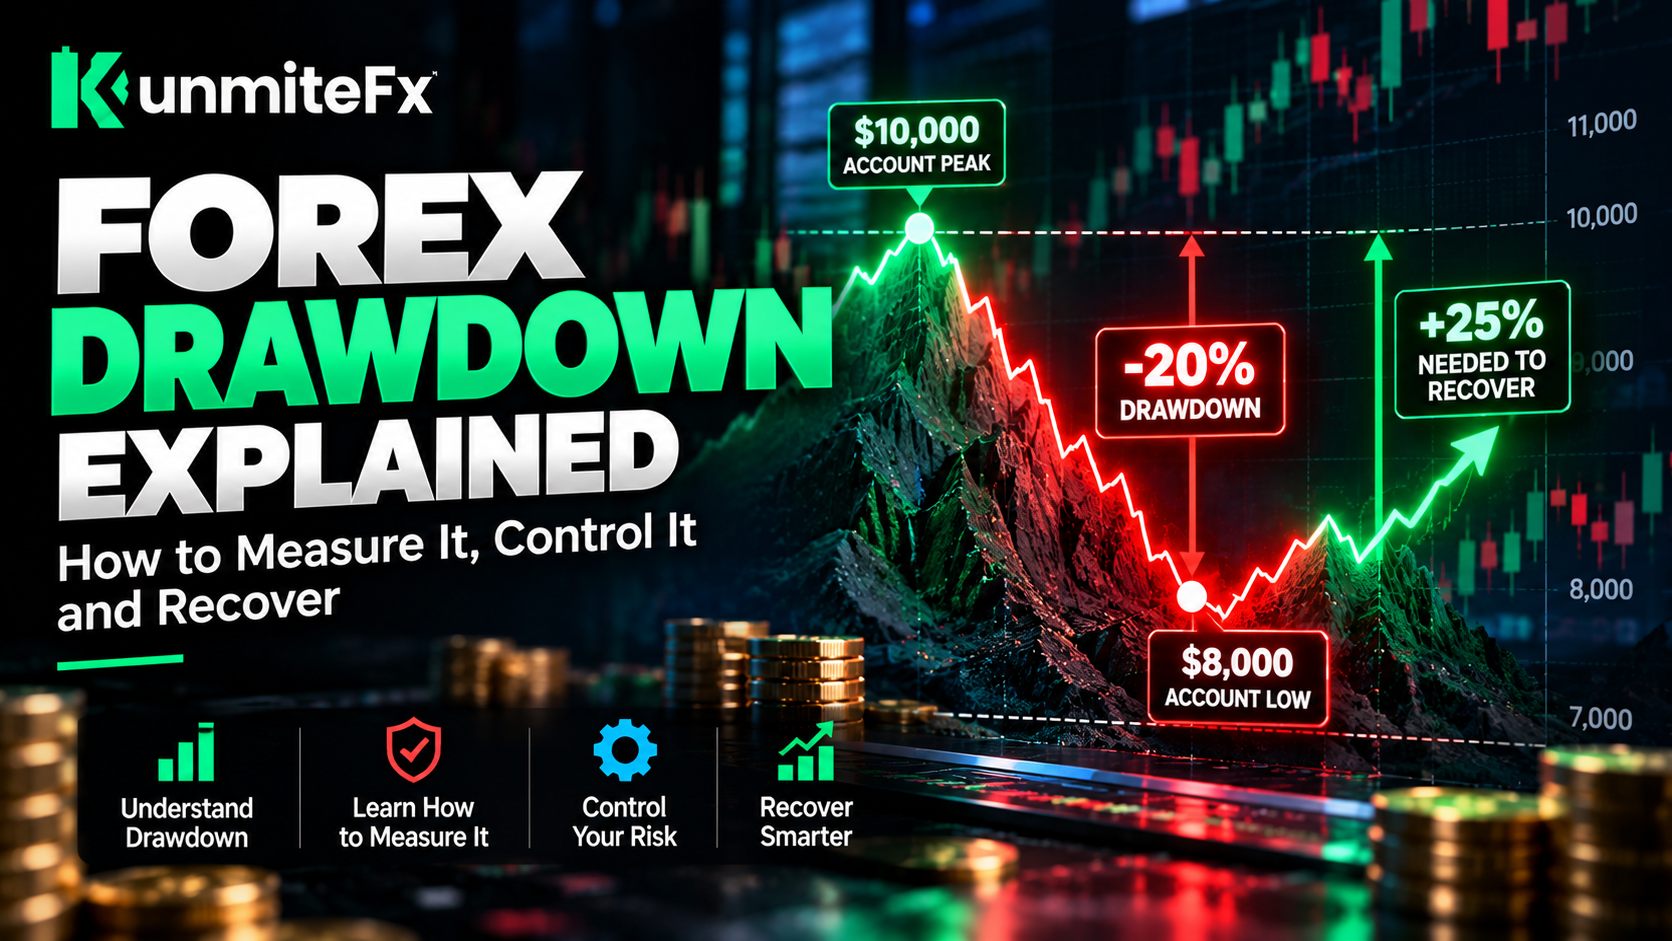
20% Drawdown
Account falls from:
$10,000 to $8,000
To recover:
$2,000 ÷ $8,000 = 25%
Required recovery:
25%
30% Drawdown
Account falls to:
$7,000
Required recovery:
Approximately 42.9%
50% Drawdown
Account falls to:
$5,000
To return to $10,000:
$5,000 ÷ $5,000 = 100%
Required recovery:
100%
This creates one of the most important lessons in risk management:
Preventing very large drawdowns can be much easier than recovering from them.
Drawdown Recovery Table
DrawdownGain Needed to Recover5%5.3%10%11.1%20%25%30%42.9%40%66.7%50%100%60%150%
Notice how quickly the recovery requirement increases.
A trader who loses 50% of their account must double the remaining capital just to return to the previous high.
How Risk Per Trade Affects Drawdown
This connects directly to our previous KunmiteFX article about the 1% rule.
Imagine two traders experience five losing trades in a row.
Trader A
Risk per trade:
1%
Ignoring compounding for simplicity:
Five losses represent approximately:
5%
Trader B
Risk per trade:
5%
Five losses could represent approximately:
25%
The trading strategy could be identical.
The difference is the amount of risk taken on each trade.
This demonstrates why position size can have a huge effect on drawdown.
Losing Streaks Are Normal
Even profitable trading strategies can experience consecutive losses.
Suppose a strategy wins:
60% of its trades
That does not mean the trader will experience a repeating pattern of:
win, win, loss, win, loss.
Results can arrive in clusters.
You might experience:
loss, loss, loss, loss
followed later by several winning trades.
This is why a risk-management plan should be designed to survive losing streaks.
If four or five ordinary losses can seriously damage the account, risk per trade may be too high.
Example: The Effect of Different Risk Levels
Suppose two traders both start with:
$10,000
Both experience six losing trades.
Trader A Risks 1%
Approximate loss per trade:
$100
Six losses:
Approximately $600
Account:
Approximately $9,400
Trader B Risks 5%
Approximate loss per trade:
$500
Six losses:
Approximately $3,000
Account:
Approximately $7,000
Again, this simplified example ignores compounding.
But it illustrates the basic principle:
Higher risk causes drawdown to accelerate much faster.
Drawdown and Position Sizing
Position sizing is one of the most direct ways to control drawdown.
Suppose a trade has a stop loss of:
50 pips
If your position size is calculated so that 50 pips represents:
$20
your financial risk is approximately $20.
If you double the position size while keeping the same stop:
your financial risk approximately doubles too.
The market setup did not change.
The stop did not change.
The difference was position size.
This is why the KunmiteFX risk framework always connects:
Stop Loss + Position Size + Risk Percentage
Drawdown and Leverage
Leverage can accelerate drawdown when traders use it to create oversized positions.
A broker may allow you to control a large amount of market exposure with a relatively small account.
But if your position becomes too large, even a modest market move can represent a significant percentage loss.
Available leverage should therefore not determine the size of your trade.
Your risk plan should.
Remember:
Leverage gives you capacity.
Risk management determines how much of that capacity you use.
Drawdown and Risk-to-Reward
A strategy's risk-to-reward ratio can also affect its drawdown characteristics.
Imagine a strategy with:
1:2 risk-to-reward
The trader risks:
$50
to potentially make:
$100
A losing streak may reduce the account temporarily, while a later series of larger winning trades could recover those losses.
But risk-to-reward alone does not guarantee recovery.
The strategy still needs a suitable win rate and consistent execution.
A 1:5 risk-to-reward ratio means very little if the profit target is so unrealistic that winning trades rarely occur.
What Causes Large Drawdowns?
Several behaviours can cause drawdown to increase rapidly.
1. Risking Too Much Per Trade
Large position sizes make every losing trade more damaging.
2. Increasing Risk After Losses
Trying to recover quickly by increasing the next position can make a normal losing streak much worse.
3. Overtrading
Taking many unnecessary trades can increase exposure without increasing strategy quality.
4. Trading Correlated Positions
Several positions may appear separate while actually depending on the same market movement.
5. Moving Stop Losses
Moving a stop farther away can increase the loss beyond what was originally planned.
6. Ignoring Total Portfolio Risk
Risking 1% on five simultaneous trades does not necessarily mean your account has only 1% exposure.
7. Using Excessive Leverage
Leverage can multiply the effect of relatively small price movements.
What Is an Acceptable Drawdown?
There is no universal percentage that every trader should consider acceptable.
The answer depends on factors such as:
trading strategy
risk tolerance
account size
trade frequency
leverage
expected losing streaks
investment objectives
What matters is having a predefined limit.
A trader might decide that if their account falls a certain percentage from its peak, they will reduce position sizes or stop live trading temporarily and review performance.
The exact percentage is less important than having a plan before emotions take over.
What Should You Do During a Drawdown?
Drawdown can be one of the most psychologically difficult periods in trading.
The temptation is often to trade more aggressively to recover.
That is usually when risk can increase further.
A more structured response may include:
Review Your Trading Journal
Determine whether the losses came from:
normal strategy performance
poor execution
breaking trading rules
unusual market conditions
Reduce Risk
If drawdown is becoming uncomfortable, reducing position sizes can slow further losses while you evaluate performance.
Avoid Revenge Trading
One loss does not need to be recovered by the next trade.
Review Your Strategy
Ask whether current market conditions still suit the strategy.
Check Correlation
Make sure multiple positions are not exposing the account to the same underlying risk.
Example: Reducing Risk During Drawdown
Suppose your normal risk is:
1% per trade
Your account enters a drawdown period.
Instead of increasing risk to recover faster, you decide to temporarily reduce risk to:
0.5%
This reduces the financial impact of each additional losing trade.
Once performance stabilizes and your trading process is reviewed, you can decide whether to return to your normal risk level.
The important principle is:
Respond to drawdown by increasing discipline, not desperation.
Drawdown and Trading Psychology
Drawdown is not only a mathematical problem.
It is psychological.
A trader may begin with a clear strategy.
After several losses they may:
hesitate on good setups
enter poor setups
increase position size
remove stop losses
exit winners too early
chase the market
abandon the strategy completely
This is why risk levels should be small enough that a losing streak does not completely change your behaviour.
A technically good strategy can still fail if the trader cannot follow it during difficult periods.
Keep a Drawdown Record
Your trading journal should track more than wins and losses.
Consider recording:
starting account equity
highest account equity
current equity
current drawdown
maximum drawdown
number of consecutive losses
risk per trade
total open risk
Over time, this data can help you understand how your strategy behaves.
For example, if the historical maximum drawdown has been around 8% and suddenly reaches 20%, that may be a reason to investigate what has changed.
Example: Complete Risk and Drawdown Framework
Suppose a trader has:
Account balance: $10,000
Risk per trade:
1%
Maximum planned loss:
$100
The trader sets a logical stop loss and calculates a position size where the stop represents approximately $100.
The trader also decides:
If account drawdown reaches:
10%
they will reduce risk.
If it reaches:
15%
they will stop opening new trades temporarily and review the strategy.
Now the trader has rules for both:
individual trade risk
and:
overall account risk
This creates a much more complete risk-management system.
The KunmiteFX Risk Framework
Our risk-management series now includes six connected concepts.
Position Sizing
Determines how large each position should be.
Risk-to-Reward
Compares potential loss with potential profit.
Stop Loss
Defines where the trade idea becomes invalid.
Leverage and Margin
Determine how much market exposure the account can support.
Risk Per Trade
Determines how much capital is exposed to one trading idea.
Drawdown
Measures how much the account has declined from a previous high.
Together:
Account Balance → Risk % → Stop Loss → Position Size → Leverage → Risk-to-Reward → Drawdown Control
The goal is not to avoid every loss.
The goal is to prevent ordinary losses from becoming extraordinary damage.
Final Thoughts
Drawdown is part of trading.
No realistic strategy wins every trade.
What separates controlled drawdown from destructive drawdown is often the amount of risk being taken.
The deeper an account falls, the harder the mathematical recovery becomes.
That is why protecting capital matters.
Before every trade, know:
how much you are risking
where your stop loss is
what position size matches that risk
how much total exposure you already have
how much drawdown you are willing to tolerate
And during losing periods, avoid the temptation to dramatically increase risk just to recover faster.
Remember:
You do not have to recover a drawdown in one trade.
The first goal is to stop the drawdown from becoming unnecessarily large.
Use the KunmiteFX Position Calculator to estimate your position size before trading and continue with the other KunmiteFX risk-management guides to build a more structured approach to protecting your trading capital.
Continue building your trading knowledge with KunmiteFX educational tools and resources.