Forex Candlestick Patterns for Beginners: How to Read Rejection, Momentum and Confirmation
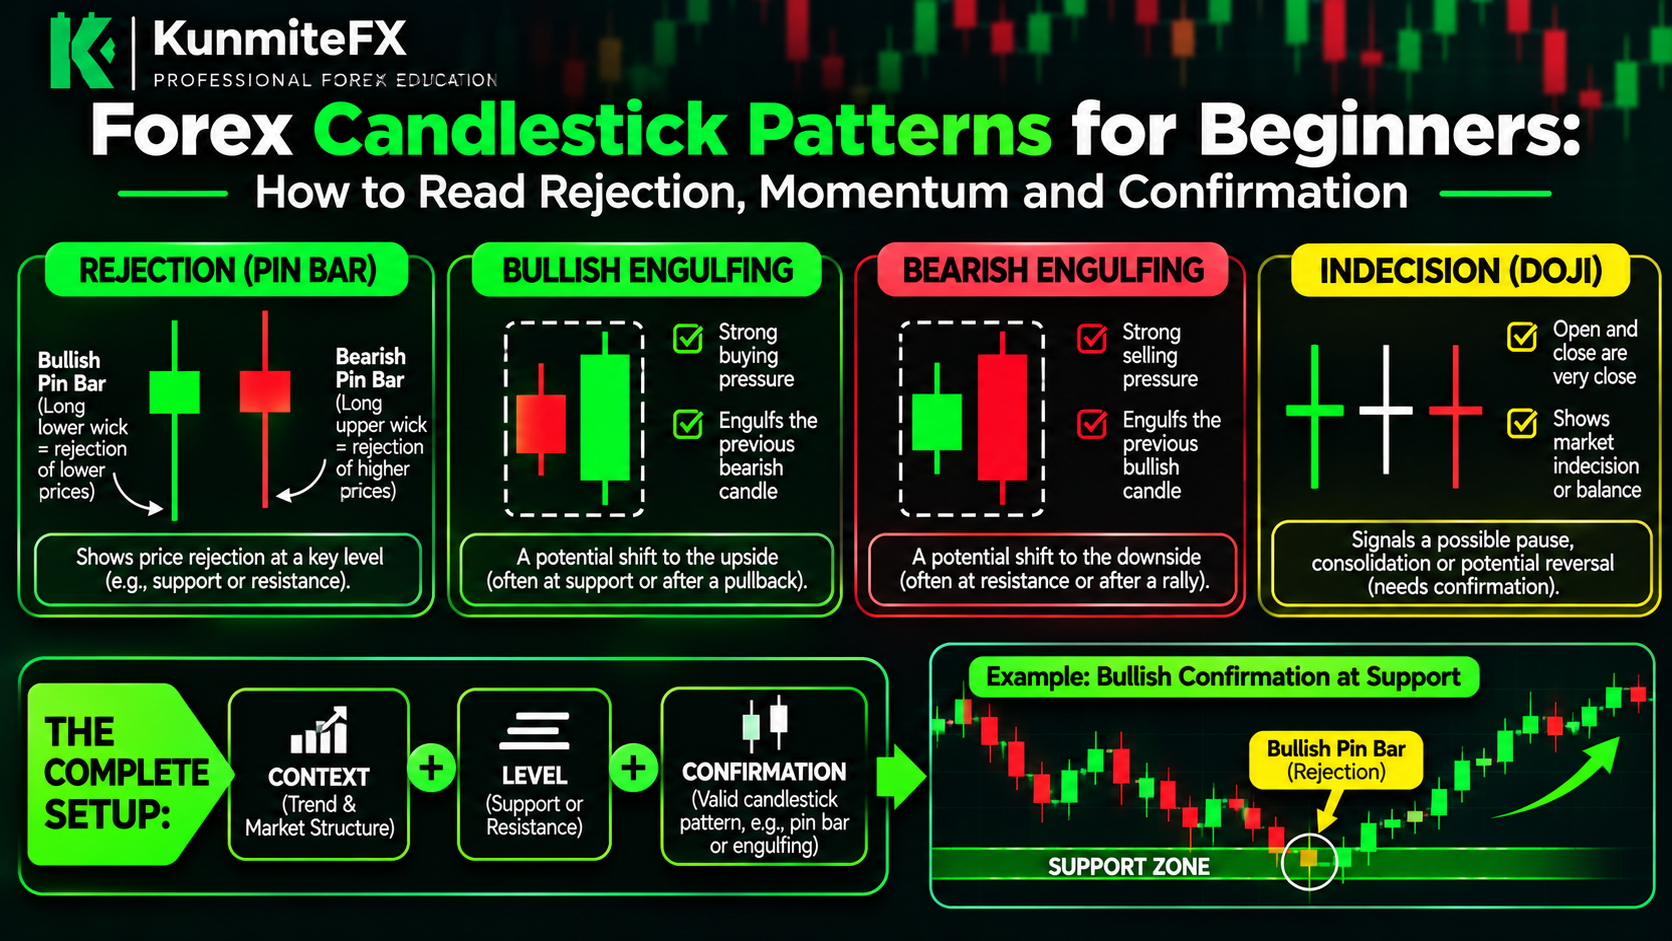
Forex Candlestick Patterns for Beginners: How to Read Rejection, Momentum and Confirmation
Candlesticks are one of the first things traders see when they open a forex chart.
Green candles.
Red candles.
Long wicks.
Small bodies.
Large bodies.
Patterns everywhere.
It is easy to assume that each pattern has a fixed meaning.
For example:
“A pin bar means price will reverse.”
or:
“A bullish engulfing candle means buy.”
But candlesticks become far more useful when they are read together with:
market structure
support and resistance
breakout and retest
trend direction
risk management
A candlestick pattern is not a prediction by itself.
It is evidence.
The question is:
What is the candle telling you about the battle between buyers and sellers?
What Is a Forex Candlestick?
A candlestick represents price movement during a specific period.
For example, on a:
1-hour chart
each candle represents one hour of price action.
On a:
15-minute chart
each candle represents 15 minutes.
Every standard candlestick contains four important prices:
Open
High
Low
Close
These four values form the candle.
The Candlestick Body
The body shows the distance between the:
open
and:
close
If price closes above the open, the candle is typically shown as bullish.
If price closes below the open, it is usually shown as bearish.
A large body can suggest strong directional movement.
A small body can suggest indecision or weak momentum.
But context matters.
What Are Candlestick Wicks?
The thin lines above and below the body are called:
wicks
or:
shadows
They show the highest and lowest prices reached during that candle.
Wicks can provide information about rejection.
For example:
A long lower wick may show that sellers pushed price lower but buyers later forced price back up.
A long upper wick may show that buyers pushed price higher but sellers later forced price back down.
Again:
A wick alone is not enough to justify a trade.
Bullish Candle
A bullish candle means price closed above where it opened.
Example:
Open:
1.1000
Close:
1.1050
Price increased during that period.
A large bullish body can indicate strong buying momentum.
Bearish Candle
A bearish candle closes below where it opened.
Example:
Open:
1.1050
Close:
1.1000
A strong bearish candle may suggest selling pressure.
Candle Size Matters
Compare two bullish candles.
Candle A
Open:
1.1000
Close:
1.1005
Candle B
Open:
1.1000
Close:
1.1050
Both are bullish.
But Candle B represents much stronger movement.
That may indicate greater momentum.
However, a large candle after an already extended move can also mean entering late.
What Is Rejection?
Rejection occurs when price attempts to move through an area but fails to remain there.
Suppose resistance is:
1.1000
Price trades above it to:
1.1030
but later closes back below:
1.1000
The upper wick may show rejection of higher prices.
This becomes more meaningful if the rejection occurs at:
resistance
a previous swing high
a higher-timeframe level
the retest of a broken support zone
What Is a Pin Bar?
A pin bar usually has:
a small body
a long wick on one side
a relatively short wick on the other side
A bullish pin bar often has a long lower wick.
A bearish pin bar often has a long upper wick.
The long wick can indicate rejection.
Bullish Pin Bar Example
Suppose price falls into support.
During the candle:
Sellers push price lower.
Buyers then respond strongly.
The candle closes near its upper area.
The result is a long lower wick.
This may suggest rejection of lower prices.
If this happens within:
bullish market structure
at:
higher-timeframe support
the pattern may become more meaningful.
Bearish Pin Bar Example
Suppose price rallies into resistance.
Buyers push price higher.
Sellers respond.
The candle closes much lower.
A long upper wick remains.
This may indicate rejection of higher prices.
Again:
Location matters.
A random bearish pin bar in the middle of nowhere may be far less useful than one at major resistance.
What Is an Engulfing Candle?
An engulfing pattern generally involves a strong candle whose body covers or overwhelms the body of the previous candle.
There are two common types:
Bullish engulfing
and:
Bearish engulfing
Bullish Engulfing Pattern
A bullish engulfing candle occurs when strong buying pressure follows a bearish candle.
For example:
First candle:
small bearish body
Second candle:
large bullish body that covers the previous body's range
This may suggest that buyers have taken control.
The pattern may be more useful when it appears:
at support
after a pullback
during bullish structure
after a breakout and retest
Bearish Engulfing Pattern
A bearish engulfing pattern is the opposite.
A strong bearish candle overwhelms the body of the previous bullish candle.
This can show increased selling pressure.
It may be more meaningful at:
resistance
a lower high
bearish retest
higher-timeframe supply area
Engulfing Candles and Momentum
The main idea behind an engulfing candle is not the name.
It is the shift in momentum.
Imagine small bullish candles moving slowly into resistance.
Then a large bearish candle appears and closes strongly lower.
That may indicate sellers have become more aggressive.
What Is an Inside Bar?
An inside bar is a candle whose range sits within the range of the previous candle.
It can show:
consolidation
hesitation
reduced volatility
Some traders use inside bars as breakout setups.
But an inside bar does not automatically indicate direction.
The surrounding context matters.
What Is a Doji?
A doji forms when the open and close are very close.
It often has a very small body.
A doji can suggest:
indecision
Neither buyers nor sellers maintained strong control during that candle.
A doji at a key level may be interesting.
A doji in the middle of random price action may mean very little.
What Is a Marubozu Candle?
A marubozu-style candle has a large body and little or no wick.
A bullish version suggests strong buying from open to close.
A bearish version suggests strong selling.
These candles can indicate momentum.
But chasing after one large momentum candle can create poor entries.
Rejection vs Momentum
Candlestick analysis can broadly focus on two ideas.
Rejection
Often represented by long wicks.
Momentum
Often represented by large bodies and strong closes.
A good trader learns to distinguish between:
price attempted to move there but failed
and:
price moved there aggressively and closed strongly
Candle Location Is More Important Than Candle Name
This is one of the most important ideas in candlestick trading.
Imagine a bullish engulfing candle appears.
Scenario A:
It forms in the middle of a random range.
Scenario B:
It forms at major support after a higher-timeframe bullish pullback.
Same candle pattern.
Different context.
Scenario B may provide much stronger information.
Candlestick Confirmation at Support
Suppose market structure is bullish.
Price pulls back into support.
You do not enter immediately.
You wait.
Then price forms:
long lower wick
bullish engulfing candle
strong bullish close
This may provide confirmation that buyers are responding.
Your strategy may then allow you to consider entry.
Candlestick Confirmation at Resistance
Suppose the market is bearish.
Price rallies into resistance.
Then you observe:
rejection wick
bearish engulfing candle
strong bearish close
This may provide evidence that sellers are returning.
Candlestick Confirmation After Breakout and Retest
Consider the previous KunmiteFX article.
Resistance:
1.1000
Price breaks above.
Then returns to retest 1.1000.
Instead of buying immediately at the retest, you wait.
A bullish rejection candle forms.
Then a strong bullish candle closes above it.
This can provide additional confirmation.
Strong Close vs Weak Close
Where the candle closes can matter.
Strong Bullish Close
A bullish candle closing near its high may suggest buyers maintained control into the end of the period.
Weak Bullish Close
A candle may rise strongly but leave a long upper wick.
That can suggest selling pressure appeared before the close.
The same logic applies to bearish candles.
Wicks Can Show Failed Movement
Suppose price trades below support.
Sellers appear to break the level.
But by candle close, price has moved back above support.
A long lower wick remains.
That can indicate:
failed bearish movement
This does not guarantee a reversal.
But it provides information.
Multiple Candles Provide More Context
One candle can be misleading.
Sometimes a better approach is to observe a sequence.
For example:
Price reaches support.
Bearish momentum slows.
A rejection wick appears.
Bullish engulfing candle follows.
Lower timeframe structure shifts bullish.
This sequence provides more context than one isolated pattern.
Candlestick Confirmation Is Not the Same as Certainty
A confirmation candle can fail.
A perfect bullish engulfing candle can be followed by a large bearish move.
Markets remain uncertain.
Confirmation should improve your decision process.
It should not create false certainty.
Timeframe Matters
A rejection candle on the:
daily chart
may carry more significance than a tiny rejection on the:
1-minute chart
But lower timeframes can still be useful for entry precision.
A common approach is:
Higher timeframe = context
Lower timeframe = confirmation
Example of Multi-Timeframe Confirmation
Suppose:
Daily:
Bullish structure.
4-hour:
Price reaches support.
15-minute:
Bullish engulfing candle appears.
5-minute:
Higher low forms.
A trader may use this sequence as evidence for a bullish setup.
Avoid Reading Every Candle
Beginners sometimes analyze every candle individually.
One bullish candle appears:
“Buy.”
Next candle is bearish:
“Sell.”
Next candle is bullish again:
“Buy.”
This creates confusion.
Candles should be interpreted within larger price structure.
Common Candlestick Mistakes
1. Trading Patterns Anywhere
A pin bar in random price action may have little meaning.
2. Ignoring Market Structure
A bullish candle inside strong bearish structure may only be a pullback.
3. Entering Before the Candle Closes
A candle can look bullish halfway through the period and close bearish.
4. Chasing Large Candles
A huge momentum candle may already have travelled most of the move.
5. Using Candles Without Risk Management
No candlestick pattern wins every time.
6. Memorizing Too Many Patterns
You do not need to memorize 50 Japanese candlestick names.
Understanding rejection, momentum and context is often more valuable.
Wait for Candle Close
Suppose a 1-hour bullish rejection candle appears.
At minute 30, it looks perfect.
You enter.
During the remaining 30 minutes, price reverses.
The candle closes bearish.
The pattern you traded never actually completed.
This is why many strategies require:
candle close confirmation
Candlesticks and Stop-Loss Placement
A candlestick can help identify invalidation.
Suppose a bullish pin bar forms at support.
Your stop might logically sit:
below the rejection low
if that level represents the point where the setup becomes invalid.
The exact placement depends on your strategy.
Then position size should be calculated based on the stop distance.
Candlesticks and Risk-to-Reward
Imagine:
Entry:
after bullish confirmation
Stop:
below rejection low
Target:
previous resistance
Before entering, calculate whether the trade offers acceptable risk-to-reward.
A beautiful candle pattern is not useful if the potential reward is too small compared with the risk.
Example Bullish Setup
Suppose:
4-hour structure:
Bullish
Support:
1.0950
Price pulls back.
A long lower wick forms.
Then a bullish engulfing candle closes.
Entry:
1.0970
Stop:
1.0940
Risk:
30 pips
Target:
1.1030
Potential reward:
60 pips
Risk-to-reward:
1:2
Then the trader calculates position size according to planned financial risk.
Example Bearish Setup
Suppose:
4-hour structure:
Bearish
Resistance:
1.2600
Price rallies.
A bearish rejection wick appears.
Then a strong bearish candle closes.
Entry:
1.2580
Stop:
1.2610
Risk:
30 pips
Target:
1.2520
Potential reward:
60 pips
Risk-to-reward:
1:2
Again, this is only an educational example.
Candlesticks During News Events
Major economic announcements can produce unusual candles.
You may see:
very large wicks
extremely large bodies
fast reversals
spread expansion
A pattern that looks attractive during a news spike may behave differently from normal market conditions.
Your trading plan should define whether you trade during major news.
Candlestick Confirmation and FOMO
Confirmation helps create patience.
Instead of saying:
“Price is at support, I need to buy now.”
you can say:
“Price is at support. I will wait for my confirmation.”
If confirmation never appears, there is no trade.
This can help reduce impulsive entries.
You Do Not Need to Catch the Exact Bottom
Many traders want to buy at the lowest possible price.
This often leads to entering too early.
Waiting for confirmation may mean entering slightly higher.
That is okay.
The objective is not to catch the exact bottom.
The objective is to execute your strategy.
You Do Not Need to Catch the Exact Top
The same principle applies to selling.
Waiting for bearish confirmation means price may already move slightly lower.
That does not automatically make the entry bad.
You are trading confirmation rather than prediction.
A Simple Candlestick Confirmation Checklist
Before using a candle pattern, ask:
Where did the candle form?
What is the market structure?
Is price at support or resistance?
Is this a breakout retest?
Is the candle showing rejection or momentum?
Has the candle closed?
Does the higher timeframe agree?
Where is invalidation?
What is my stop distance?
What position size should I use?
Does the trade meet my minimum risk-to-reward?
Pin Bar Checklist
For a pin bar, consider:
Is the wick clearly dominant?
Did the wick reject an important area?
Where did the candle close?
Is structure aligned?
Is the setup supported by another factor?
Engulfing Candle Checklist
Consider:
Is the body genuinely strong?
Did momentum change?
Did it form at an important level?
Is the higher timeframe supportive?
Is there enough room to the target?
Doji Checklist
Ask:
Is the market showing indecision at a meaningful level?
What happened before the doji?
What happens after it?
The doji itself often needs additional information.
How Candlesticks Fit the KunmiteFX Framework
The KunmiteFX learning framework now connects:
Market Structure
identifies direction.
Support and Resistance
identifies important areas.
Breakout and Retest
identifies role changes.
Candlestick Confirmation
shows how buyers and sellers respond.
Stop Loss
defines invalidation.
Position Size
controls financial exposure.
Trading Journal
records execution.
The process becomes:
Structure → Key Level → Price Reaction → Candlestick Confirmation → Entry → Stop → Position Size → Target → Journal → Review
How to Practice Candlestick Reading
You can practice without trading live money.
Open historical charts.
Hide future candles if your platform allows it.
Identify:
support
resistance
market structure
Then move candle by candle.
Ask:
What does this candle show?
Rejection?
Momentum?
Indecision?
Did confirmation work?
Did structure support it?
This helps you learn context rather than memorizing patterns.
Keep Candlestick Analysis Simple
You do not need to know every pattern ever named.
A beginner can start by understanding:
Long wick = possible rejection
Large body = possible momentum
Small body = possible indecision
Engulfing = possible momentum shift
Then combine those ideas with:
structure
key levels
trend
risk management
That is enough to build a strong foundation.
Final Thoughts
Candlestick patterns are not magic signals.
They are a visual representation of price behaviour.
A long wick tells you price tried to move somewhere and failed.
A large body tells you price moved strongly in one direction.
An engulfing candle can show a shift in momentum.
A doji can show indecision.
But these patterns become more useful when they appear at meaningful locations.
Remember:
Context first.
Candlestick second.
Risk management always.
Before entering your next trade because of one attractive candle, ask:
What is this candle confirming and what larger market context supports it?
Continue building your trading knowledge with KunmiteFX educational tools and resources.