Breakout and Retest in Forex: How to Trade Breakouts Without Chasing Price
Breakout and Retest in Forex: How to Trade Breakouts Without Chasing Price
Breakouts are one of the most exciting events on a forex chart.
Price reaches an important level.
Momentum increases.
Candles expand.
The market pushes through support or resistance.
And suddenly traders begin asking:
Should I enter now?
That is also where many mistakes happen.
A trader sees price breaking resistance and immediately buys.
The breakout fails.
Price falls back below the level.
The trader gets stopped out.
This is why many traders prefer not to chase the initial breakout.
Instead, they wait for something called a:
breakout and retest.
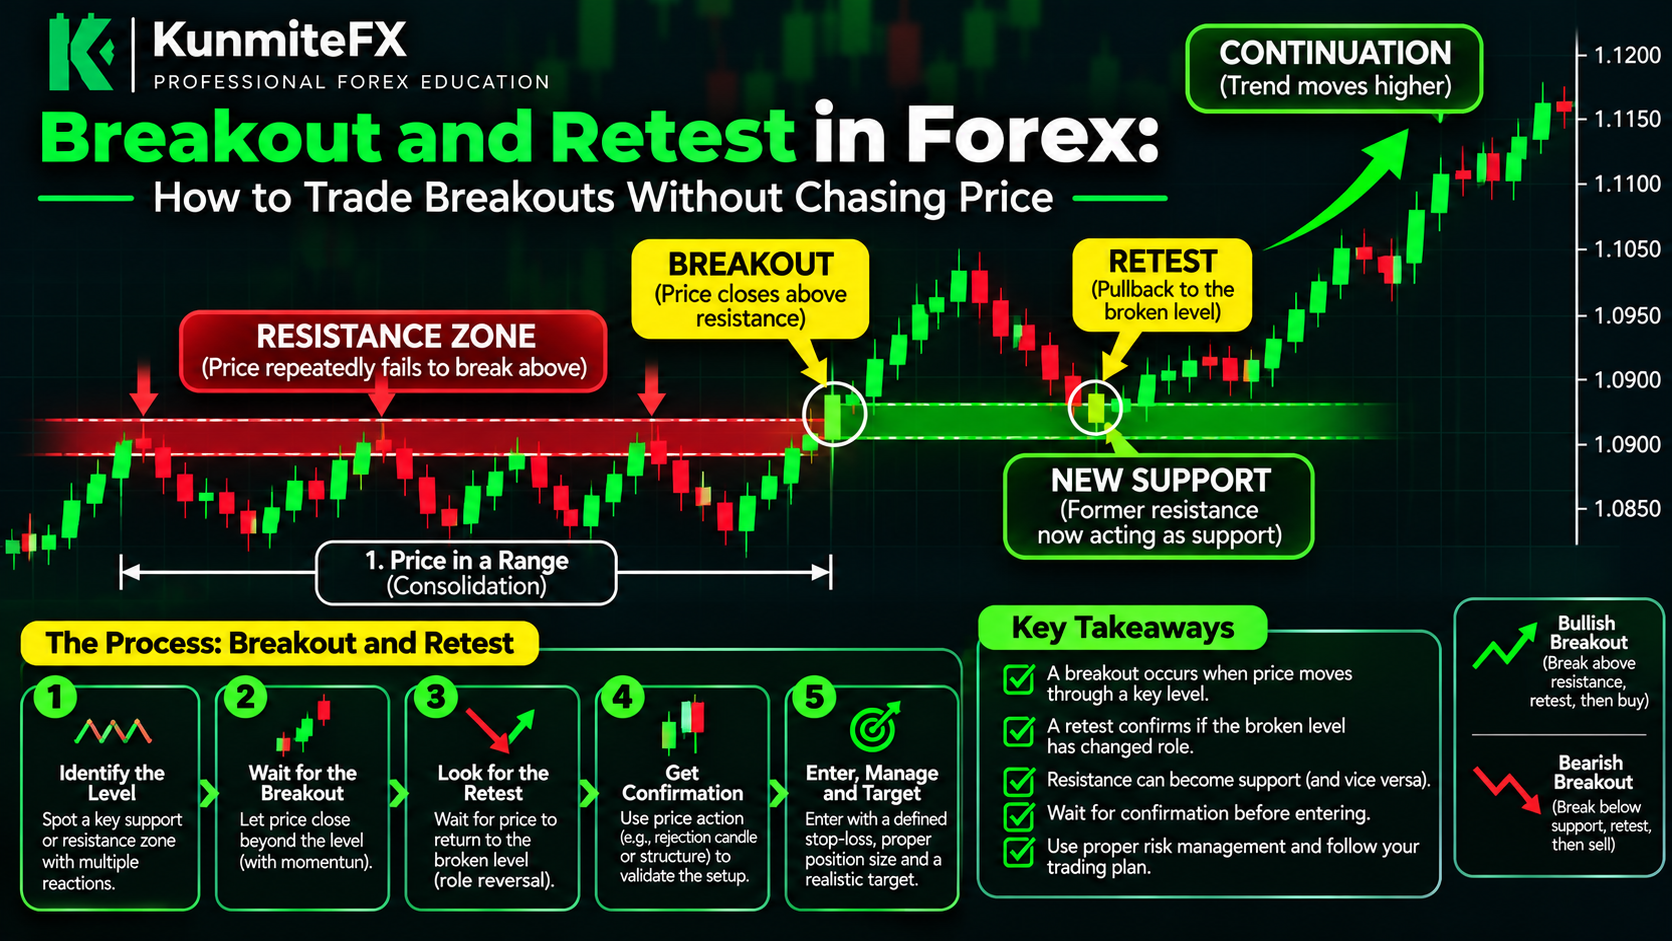
A breakout and retest gives price an opportunity to prove that the broken level may actually have changed its role.
It does not guarantee a winning trade.
But it can provide more structure than entering simply because price moved quickly through a level.
What Is a Breakout in Forex?
A breakout occurs when price moves through an important level or area.
The level may be:
resistance
support
previous swing high
previous swing low
range boundary
trendline
consolidation zone
For example:
Resistance:
1.1000
Price repeatedly fails to trade above it.
Eventually price pushes through:
1.1000
and trades higher.
That movement may be considered a bullish breakout.
Similarly, if support at:
1.2500
breaks and price continues lower, that may be considered a bearish breakout.
What Is a Retest?
A retest happens when price returns to the area that was just broken.
For example:
Resistance:
1.1000
Price breaks above it.
Instead of continuing straight upward forever, price later pulls back toward:
1.1000
If the old resistance begins acting as support, that is the retest.
The sequence becomes:
Resistance → Breakout → Pullback → Retest → Possible Continuation
This is one of the most common breakout structures traders study.
Bullish Breakout and Retest
A bullish breakout and retest may look like:
Resistance → Break Above → Retest From Above → Bullish Reaction
For example:
Resistance:
1.1000
Price breaks to:
1.1050
Then pulls back toward:
1.1000
Buyers begin responding.
Price later trades higher.
The previous resistance has potentially become:
support
This is known as:
role reversal
Bearish Breakout and Retest
The bearish version works in reverse.
Support:
1.2500
Price breaks below.
Price falls to:
1.2450
Later, price rallies back toward:
1.2500
Sellers respond.
The previous support may now act as:
resistance
The sequence becomes:
Support → Break Below → Retest From Below → Bearish Reaction
Why Traders Wait for a Retest
The initial breakout can be difficult to trade.
Price may move quickly.
Spreads may widen.
The breakout candle may already be extended.
Entering late can create:
poor stop placement
poor risk-to-reward
emotional entries
chasing price
vulnerability to false breakouts
Waiting for a retest can give the trader time to evaluate:
Did price really accept above the level?
Is the old resistance becoming support?
Is there confirmation?
Is the stop location logical?
Does the trade still offer acceptable risk-to-reward?
What Is a False Breakout?
A false breakout occurs when price moves beyond an important level but fails to continue.
For example:
Resistance:
1.1000
Price breaks to:
1.1025
Traders buy the breakout.
Then price quickly falls back below:
1.1000
and continues lower.
The breakout did not sustain.
This can trap traders who entered too early.
Why False Breakouts Happen
False breaks can occur for many reasons.
These may include:
insufficient momentum
liquidity around obvious levels
news volatility
profit taking
institutional order flow
temporary stop runs
weak market participation
The important point is:
A break beyond a level is not automatically a confirmed breakout.
Candle Close Matters
Some traders wait for the candle to close beyond the level.
For example:
Resistance:
1.1000
Price briefly trades above it.
But the candle closes back below 1.1000.
That may not be considered a convincing breakout.
If the candle closes strongly above the resistance level, traders may view the breakout differently.
This does not guarantee continuation.
But candle closes can provide additional information.
Strong Breakout vs Weak Breakout
A stronger breakout may include:
large candle body
close beyond the level
increased momentum
multiple candles holding beyond the level
alignment with market structure
clear rejection from the broken level on retest
A weaker breakout may include:
long wick beyond the level
tiny candle body
immediate rejection
lack of momentum
breakout against higher-timeframe structure
Market Structure Before the Breakout
A breakout should not be analyzed alone.
Suppose the market is already creating:
Higher Highs + Higher Lows
Price approaches resistance.
A bullish breakout may align with the existing trend.
Now imagine the market is strongly bearish.
Price makes one brief move above resistance.
The context is different.
Market structure helps determine whether a breakout is:
trend continuation
or:
potential reversal
Breakout From a Range
Breakouts often occur from consolidation.
Suppose price is trading between:
Support:
1.0900
Resistance:
1.1000
Price moves repeatedly between those levels.
Eventually it breaks above:
1.1000
That may signal the beginning of a new directional move.
A trader may wait for price to retest the old range resistance before considering a buy.
Example of a Bullish Range Breakout
Suppose EUR/USD trades inside:
1.0900–1.1000
for several days.
Resistance:
1.1000
Price closes strongly above:
1.1000
and reaches:
1.1040
Later, price pulls back toward:
1.1000
A bullish rejection forms.
The structure becomes:
Range → Breakout → Retest → Possible Continuation
A trader may then evaluate:
stop placement
position size
target
risk-to-reward
Example of a Bearish Range Breakout
Suppose GBP/USD is ranging between:
Support:
1.2500
Resistance:
1.2600
Price breaks below:
1.2500
and falls to:
1.2450
Later, price rallies toward:
1.2500
Sellers respond.
The old support may now act as resistance.
This creates a possible bearish retest setup.
Breakout and Retest With Support and Resistance
This is where the previous KunmiteFX article becomes directly useful.
Support and resistance identify the important areas.
Breakout analysis asks:
Did price move through the area?
Retest analysis asks:
Did the level change its role?
For example:
Resistance → Break → Support
or:
Support → Break → Resistance
This creates a logical progression.
Breakout and Retest With Market Structure
Suppose the market is bullish.
Structure:
HH → HL → HH
Price reaches resistance.
Price breaks above resistance.
Then pulls back.
The retest holds.
Lower timeframe begins forming:
Higher Low
That provides additional structural evidence.
The trader is not entering because of one candle.
They are combining:
trend
breakout
retest
structure
Do Retests Always Happen?
No.
Sometimes price breaks a level and continues without returning.
This is important.
If you only trade retests, you will miss some breakouts.
That is normal.
A trading strategy does not need to capture every market move.
The goal is not to catch everything.
The goal is to trade conditions that match your plan.
The Danger of Chasing Price
Suppose resistance is:
1.1000
Price breaks to:
1.1080
You become afraid of missing the move.
You buy at:
1.1080
Your logical stop may still need to be below:
1.1000
Now your stop distance is much larger.
Your target may be nearby.
Risk-to-reward becomes poor.
This is one of the dangers of chasing breakouts.
Better Entry Does Not Mean Guaranteed Trade
Waiting for a retest may provide:
tighter invalidation
better risk-to-reward
more confirmation
But even a perfect-looking retest can fail.
Markets remain uncertain.
Risk management is still necessary.
What Confirmation Can Look Like
During the retest, some traders wait for:
rejection candle
engulfing candle
lower-timeframe structure shift
failed attempt to move back through the level
momentum returning in breakout direction
The exact trigger depends on the trading strategy.
Bullish Retest Confirmation Example
Resistance breaks.
Price returns to the level.
Then:
price rejects lower prices
bullish candle closes strongly
lower timeframe produces higher low
momentum returns upward
A trader may then consider:
buy
if the setup meets the trading plan.
Bearish Retest Confirmation Example
Support breaks.
Price rallies back.
Then:
price rejects higher prices
bearish candle closes strongly
lower timeframe produces lower high
momentum returns downward
A trader may consider:
sell
if the setup qualifies.
Where Should the Stop Loss Go?
Stop placement should reflect invalidation.
Suppose you buy after a bullish breakout and retest.
A logical stop may be:
below the retest structure
or:
below the level that invalidates the breakout
The stop should not be selected randomly.
After the stop distance is known, calculate position size.
Example Position Size Logic
Account:
$5,000
Risk:
1%
Risk amount:
$50
Stop distance:
25 pips
The position size should be calculated so that approximately 25 pips against you equals about $50.
This keeps financial risk consistent.
Breakout Entry vs Retest Entry
Imagine resistance at:
1.1000
Breakout Entry
Entry:
1.1030
Stop:
1.0980
Risk:
50 pips
Retest Entry
Price later returns.
Entry:
1.1005
Stop:
1.0980
Risk:
25 pips
If the same target is used, the retest entry may offer a better risk-to-reward ratio.
This is only an example.
Real market conditions vary.
How to Set a Target
Targets may be based on:
next resistance
previous swing high
measured range
fixed risk-to-reward
market structure
For example:
Entry:
1.1005
Stop:
1.0980
Risk:
25 pips
Target:
1.1055
Potential reward:
50 pips
Risk-to-reward:
1:2
The target should still make sense structurally.
Breakouts Around Major News
Major economic events can create violent breakouts.
Examples include:
interest-rate decisions
CPI releases
NFP
central-bank speeches
Price may move through several levels very quickly.
These environments can also create sharp reversals.
Your trading plan should state whether you trade around major news.
Higher-Timeframe Breakouts
Breakouts on higher timeframes may carry more significance.
For example:
A daily resistance break may be more meaningful than a tiny breakout on a 1-minute chart.
However, higher-timeframe breakouts may also require larger stop distances.
Position size should be adjusted accordingly.
Lower-Timeframe Retests
A trader may identify the breakout on:
4-hour chart
Then use:
15-minute
or:
5-minute
for a more precise retest entry.
This is one example of multi-timeframe analysis.
The higher timeframe provides context.
The lower timeframe provides execution.
Breakout and Retest in Trending Markets
In an uptrend:
price may repeatedly break resistance and retest it as support.
This can create a stair-step structure.
For example:
Resistance → Break → Support → Rally → New Resistance → Break → Support
In a downtrend:
the opposite may happen.
Support → Break → Resistance → Drop
Breakout and Retest in Ranging Markets
Breakouts from long ranges can be particularly important.
The longer price remains trapped between support and resistance, the more attention the boundaries may receive.
When price eventually breaks, traders may watch whether the breakout holds.
Again, duration alone does not guarantee a powerful move.
Common Breakout Trading Mistakes
1. Entering Too Late
Chasing price after a large breakout candle can create poor risk-to-reward.
2. Ignoring the Candle Close
A wick beyond resistance is not always a confirmed breakout.
3. Trading Against Higher-Timeframe Structure
A small breakout may conflict with the broader trend.
4. Assuming Every Retest Will Hold
Retests can fail.
5. Using Oversized Positions
A good-looking breakout does not justify excessive risk.
6. Moving the Stop
If the breakout invalidates, accept the planned loss.
7. Entering Without a Plan
Define entry, stop, target and risk before clicking buy or sell.
Breakout Traps
A breakout trap happens when traders enter on a breakout and price quickly reverses.
For example:
Resistance:
1.1000
Price breaks above.
Buyers enter.
Price falls back below 1.1000.
The buyers are now trapped.
If price later continues lower, the failed breakout may itself become useful information.
Failed Breakout as a Signal
A failed breakout can sometimes indicate weakness.
For example:
Price attempts to break resistance.
It fails.
Price closes back below.
Market structure begins turning bearish.
That does not automatically create a sell trade.
But it may warn that buyers were unable to maintain control.
Breakout Volume
In some markets, traders use volume to evaluate breakouts.
Spot forex does not have one centralized volume source because trading occurs across multiple venues.
Some traders use:
tick volume
futures volume
broker-specific data
Volume can provide additional context, but it should be understood carefully.
Breakout and Retest Checklist
Before entering, ask:
What level is breaking?
Is it important on the higher timeframe?
What is the market structure?
Did the candle close beyond the level?
Was momentum strong or weak?
Is this a breakout or only a wick?
Did price retest the level?
Is old resistance acting as support?
Is old support acting as resistance?
Is there confirmation?
Where is invalidation?
What is the stop distance?
What is my position size?
What is the risk-to-reward?
Is major news approaching?
Example of a Complete Bullish Breakout Trade
Higher timeframe:
Bullish
Resistance:
1.1000
Price closes above:
1.1000
Breakout high:
1.1050
Price pulls back toward:
1.1000
Retest holds.
Lower timeframe creates:
Higher Low
Entry:
after bullish confirmation.
Stop:
below retest structure.
Target:
next resistance.
Risk:
1%
The trader records the setup in the journal.
This is a structured process.
Example of a Complete Bearish Breakout Trade
Higher timeframe:
Bearish
Support:
1.2500
Price closes below:
1.2500
Price falls to:
1.2450
Later price rallies back toward:
1.2500
Retest fails.
Lower timeframe forms:
Lower High
Entry:
after bearish confirmation.
Stop:
above invalidation.
Target:
next support.
Risk:
controlled according to the trading plan.
Breakout Trading and Psychology
Breakouts can create strong FOMO.
Price moves quickly.
You see the candle expanding.
You feel that if you do not enter immediately, you will miss the opportunity.
This is exactly why having a written plan matters.
Your rule might say:
I do not chase breakout candles.
Or:
I only enter after a retest.
This removes the need to make the decision emotionally.
Missing a Trade Is Not a Trading Loss
Suppose price breaks resistance and never retests.
You miss the move.
That does not mean your strategy failed.
You followed your rules.
There will be other setups.
A missed opportunity is different from losing money.
How Breakout and Retest Fits the KunmiteFX Framework
The KunmiteFX educational framework now connects:
Market Structure
identifies direction.
Support and Resistance
identifies important levels.
Breakout
shows price moving through a level.
Retest
tests whether that level changed role.
Trading Plan
defines whether you are allowed to enter.
Stop Loss
defines invalidation.
Position Size
controls financial exposure.
Trading Journal
records the outcome.
The full process becomes:
Structure → Level → Breakout → Retest → Confirmation → Risk Calculation → Entry → Journal → Review
How to Practice Breakout and Retest
You can practice this concept using historical charts.
Find:
ranges
major support
major resistance
breakout candles
retests
failed breakouts
Then ask:
Did the breakout hold?
Was there a retest?
Did the old level change role?
What happened after confirmation?
What did market structure show?
This helps build recognition without risking real money.
Final Thoughts
Breakout trading does not need to mean chasing price.
A more structured approach is:
Identify the level.
Wait for the breakout.
Observe the close.
Wait for the retest if your strategy requires one.
Look for confirmation.
Calculate risk.
Enter only if the setup still meets your plan.
Remember:
Not every breakout is real.
Not every breakout retests.
Not every retest holds.
No breakout setup guarantees profit.
The goal is not to enter every move.
The goal is to trade a repeatable process.
Before chasing the next breakout candle, ask yourself:
Am I following my strategy—or am I simply afraid of missing the move?
Continue building your trading knowledge with KunmiteFX educational tools and resources.